Prompts and Charts for Intervals.icu Athletes

By Toby Pattullo
Australian Deaflympic marathon and ultra runner, and the solo developer behind IcuSync.
These prompts are starting points. Claude works best when you give it context, so adapt any of them to include your goal race, your current training phase, or anything else relevant to your situation.
The more specific you are, the more useful the response. A prompt like "build me a workout" will get you something generic. A prompt like "build me a threshold session for Wednesday, I am in week two of a marathon build and my legs are still a bit heavy from Sunday's long run" will get you something that actually fits where you are.
Before diving into prompts, it helps to know what data IcuSync can access. Read: [How to find your personal bests with IcuSync →]
Understanding your training data
What does my recent training look like?
Look at my last four weeks of training. Summarise my total weekly load, how my fitness and fatigue are trending, and whether my training has been consistent. Flag anything that stands out.
Am I overtraining or undertraining?
Based on my last six weeks of data, is my training load appropriate? Am I showing signs of accumulating too much fatigue, or am I not training enough to make progress? Be honest.
How has my fitness changed over the last three months?
Pull my fitness data for the last 90 days and tell me how my fitness has changed. Is the trend positive? Are there any gaps or drops worth noting?
What are my current training zones?
Read my athlete profile and tell me my current running zones based on my threshold pace. List each zone with its pace range and a brief description of what each one is for.
How does my training compare to the same period last year?
Compare my training load and consistency over the last eight weeks with the same period twelve months ago. Am I in a better or worse position heading into this training block?
Analysing your completed activities in detail
Claude can retrieve interval by interval data from any completed activity including pace, power, heart rate, and elevation for each segment. This lets you go beyond the summary numbers and understand exactly how a session actually went.
Claude finds the activity automatically from your recent training history so you do not need to look anything up yourself.
How did my intervals go in my last session?
Analyse my last run in detail. How did my efforts go? Were my intervals consistent and did I hit my targets?
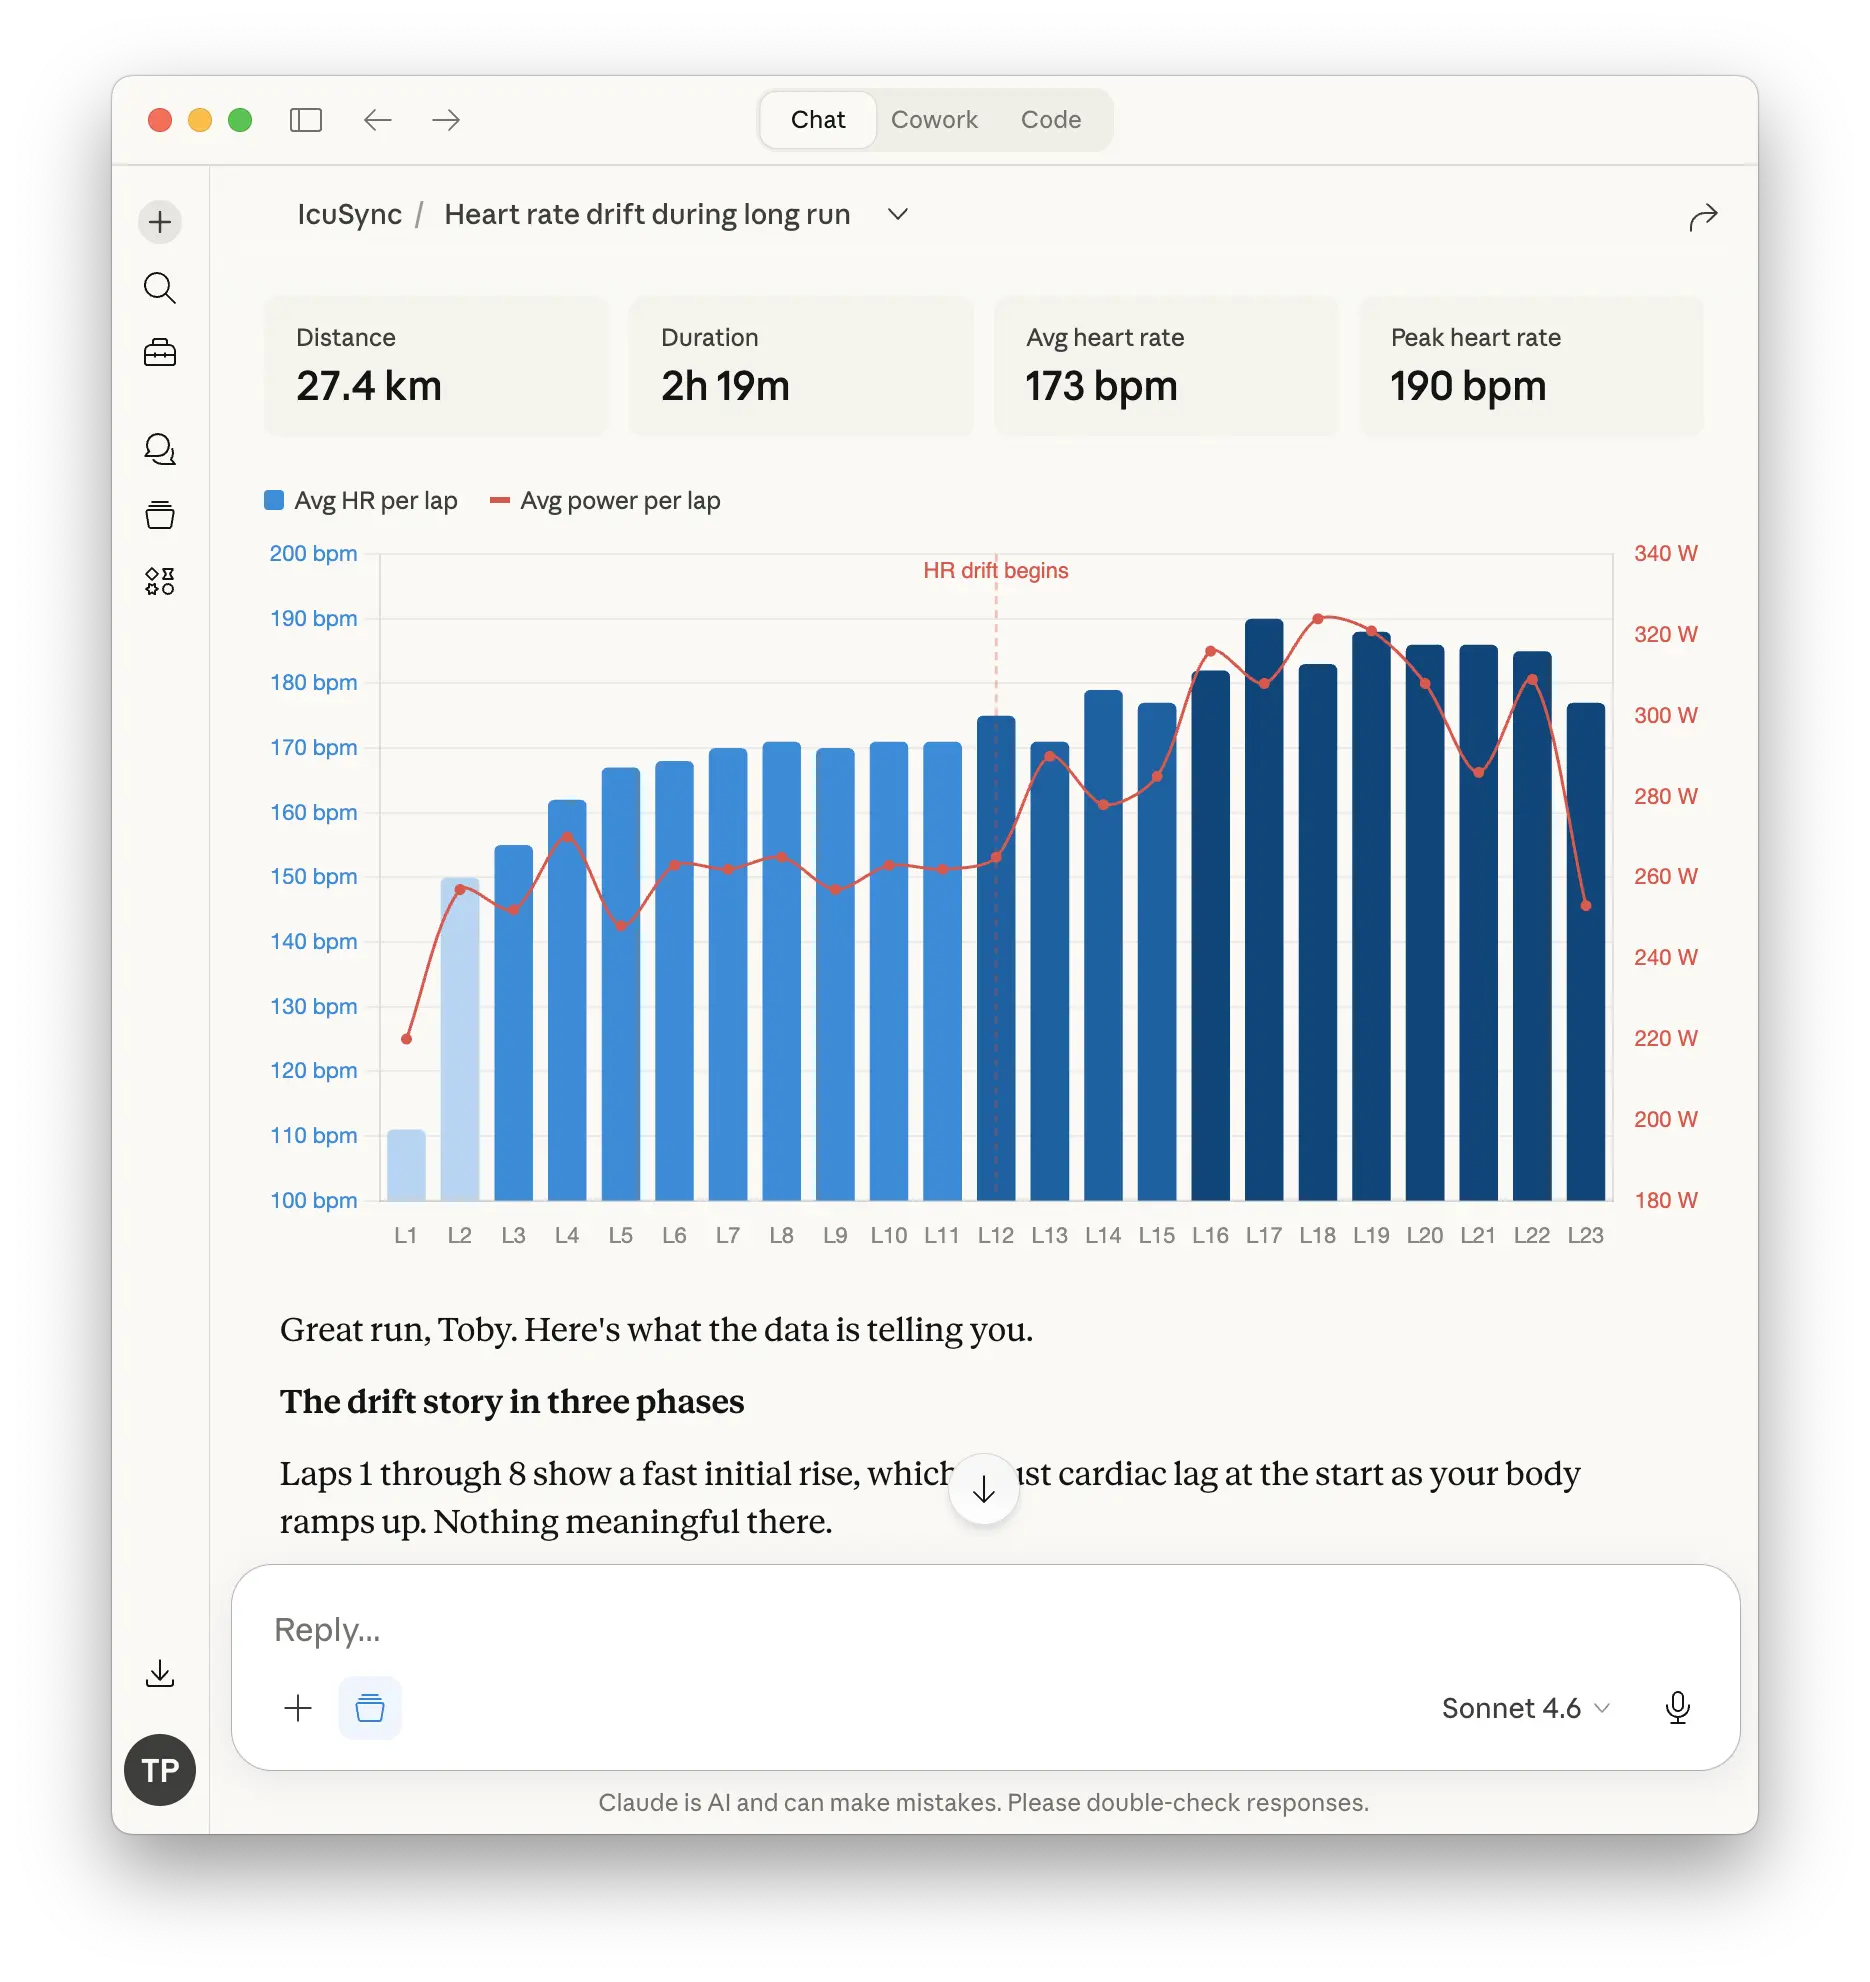
How did my heart rate respond across my long run?
Show me how my heart rate drifted across yesterday's long run. At what point did it start to climb and what does that tell me about my aerobic fitness?
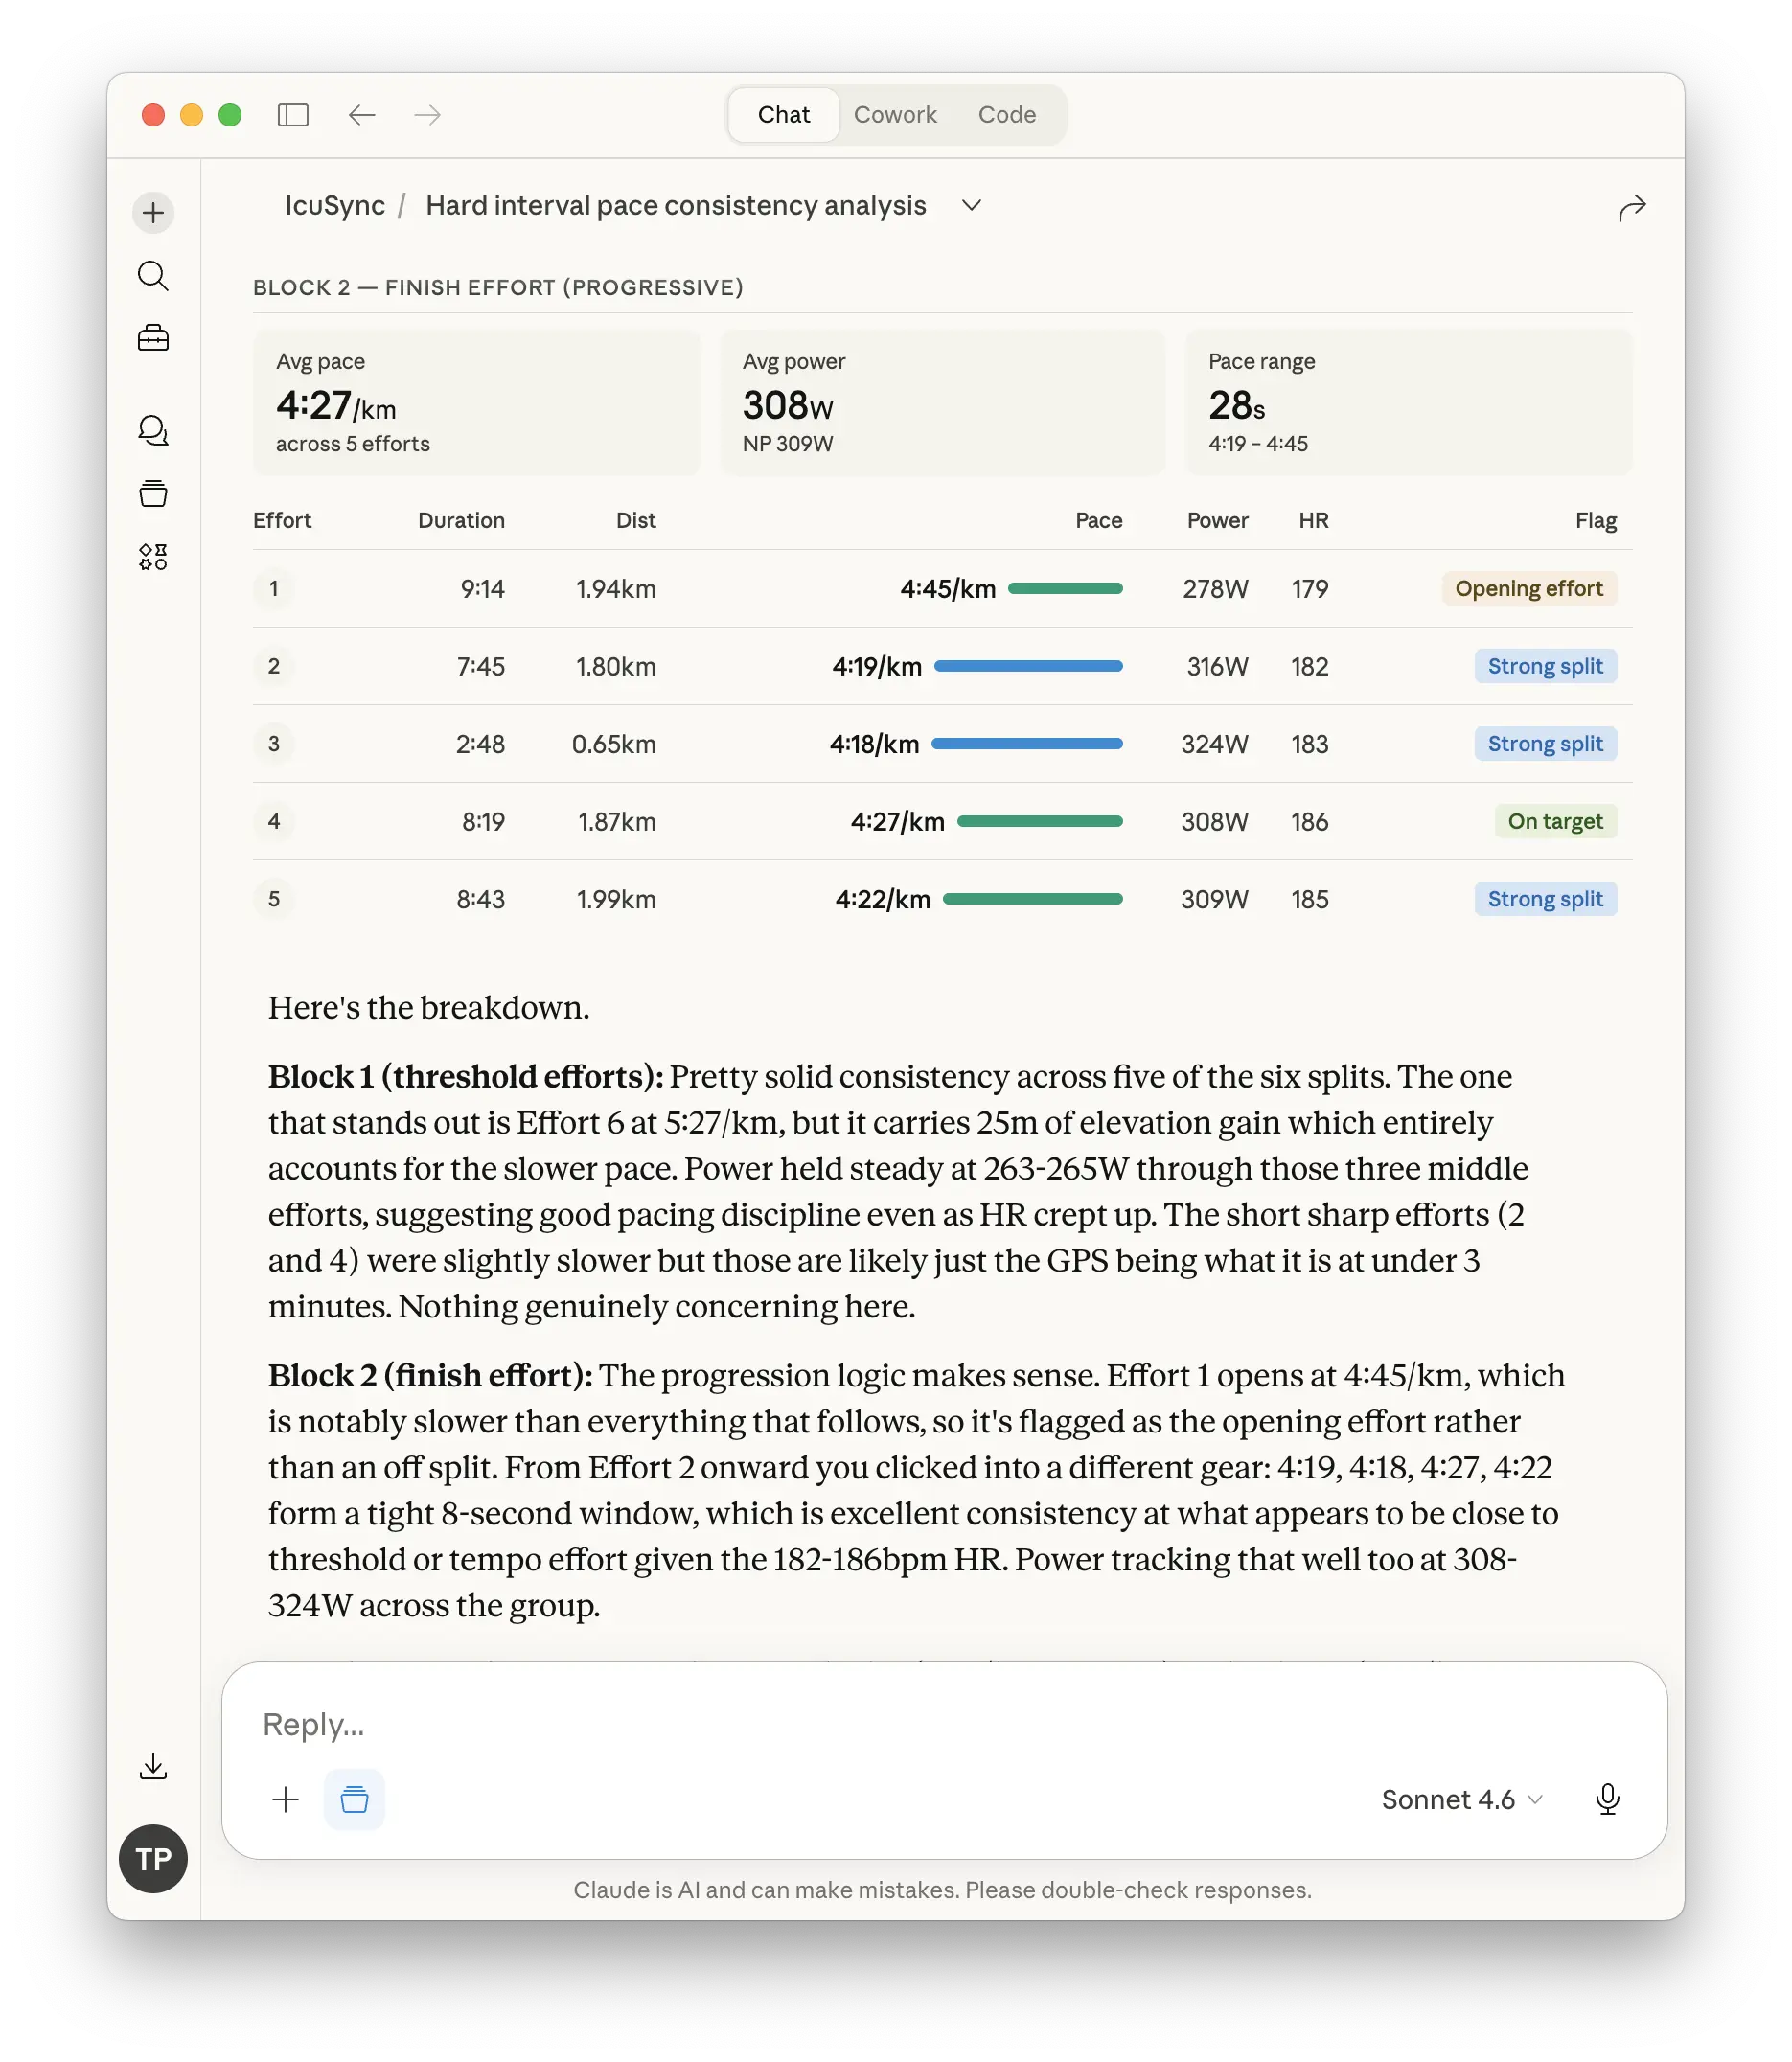
How consistent was my pacing?
How consistent was my pace across the hard intervals in this morning's session? Show me the splits and flag any efforts that were significantly off target.
Power in hard versus easy sections
Compare my power output in the hard intervals versus the easy recovery sections of today's session. Was my recovery power genuinely easy or was I working too hard between efforts?
Heart rate in a specific zone
What was my average heart rate during the easy Z2 portion of my long run yesterday? How much time did I actually spend in Z2 versus drifting into Z3?
Visualising your progress with charts
One of the more powerful things Claude can do with your Intervals.icu data is generate charts and visual summaries of your training history and progress. You do not need to export data or use a spreadsheet, ask Claude directly and it will build the chart from your data in the conversation.
Generate a fitness trend chart
Pull my fitness and fatigue data for the last 16 weeks and generate a chart showing how both have changed over time. Mark any significant peaks or drops.
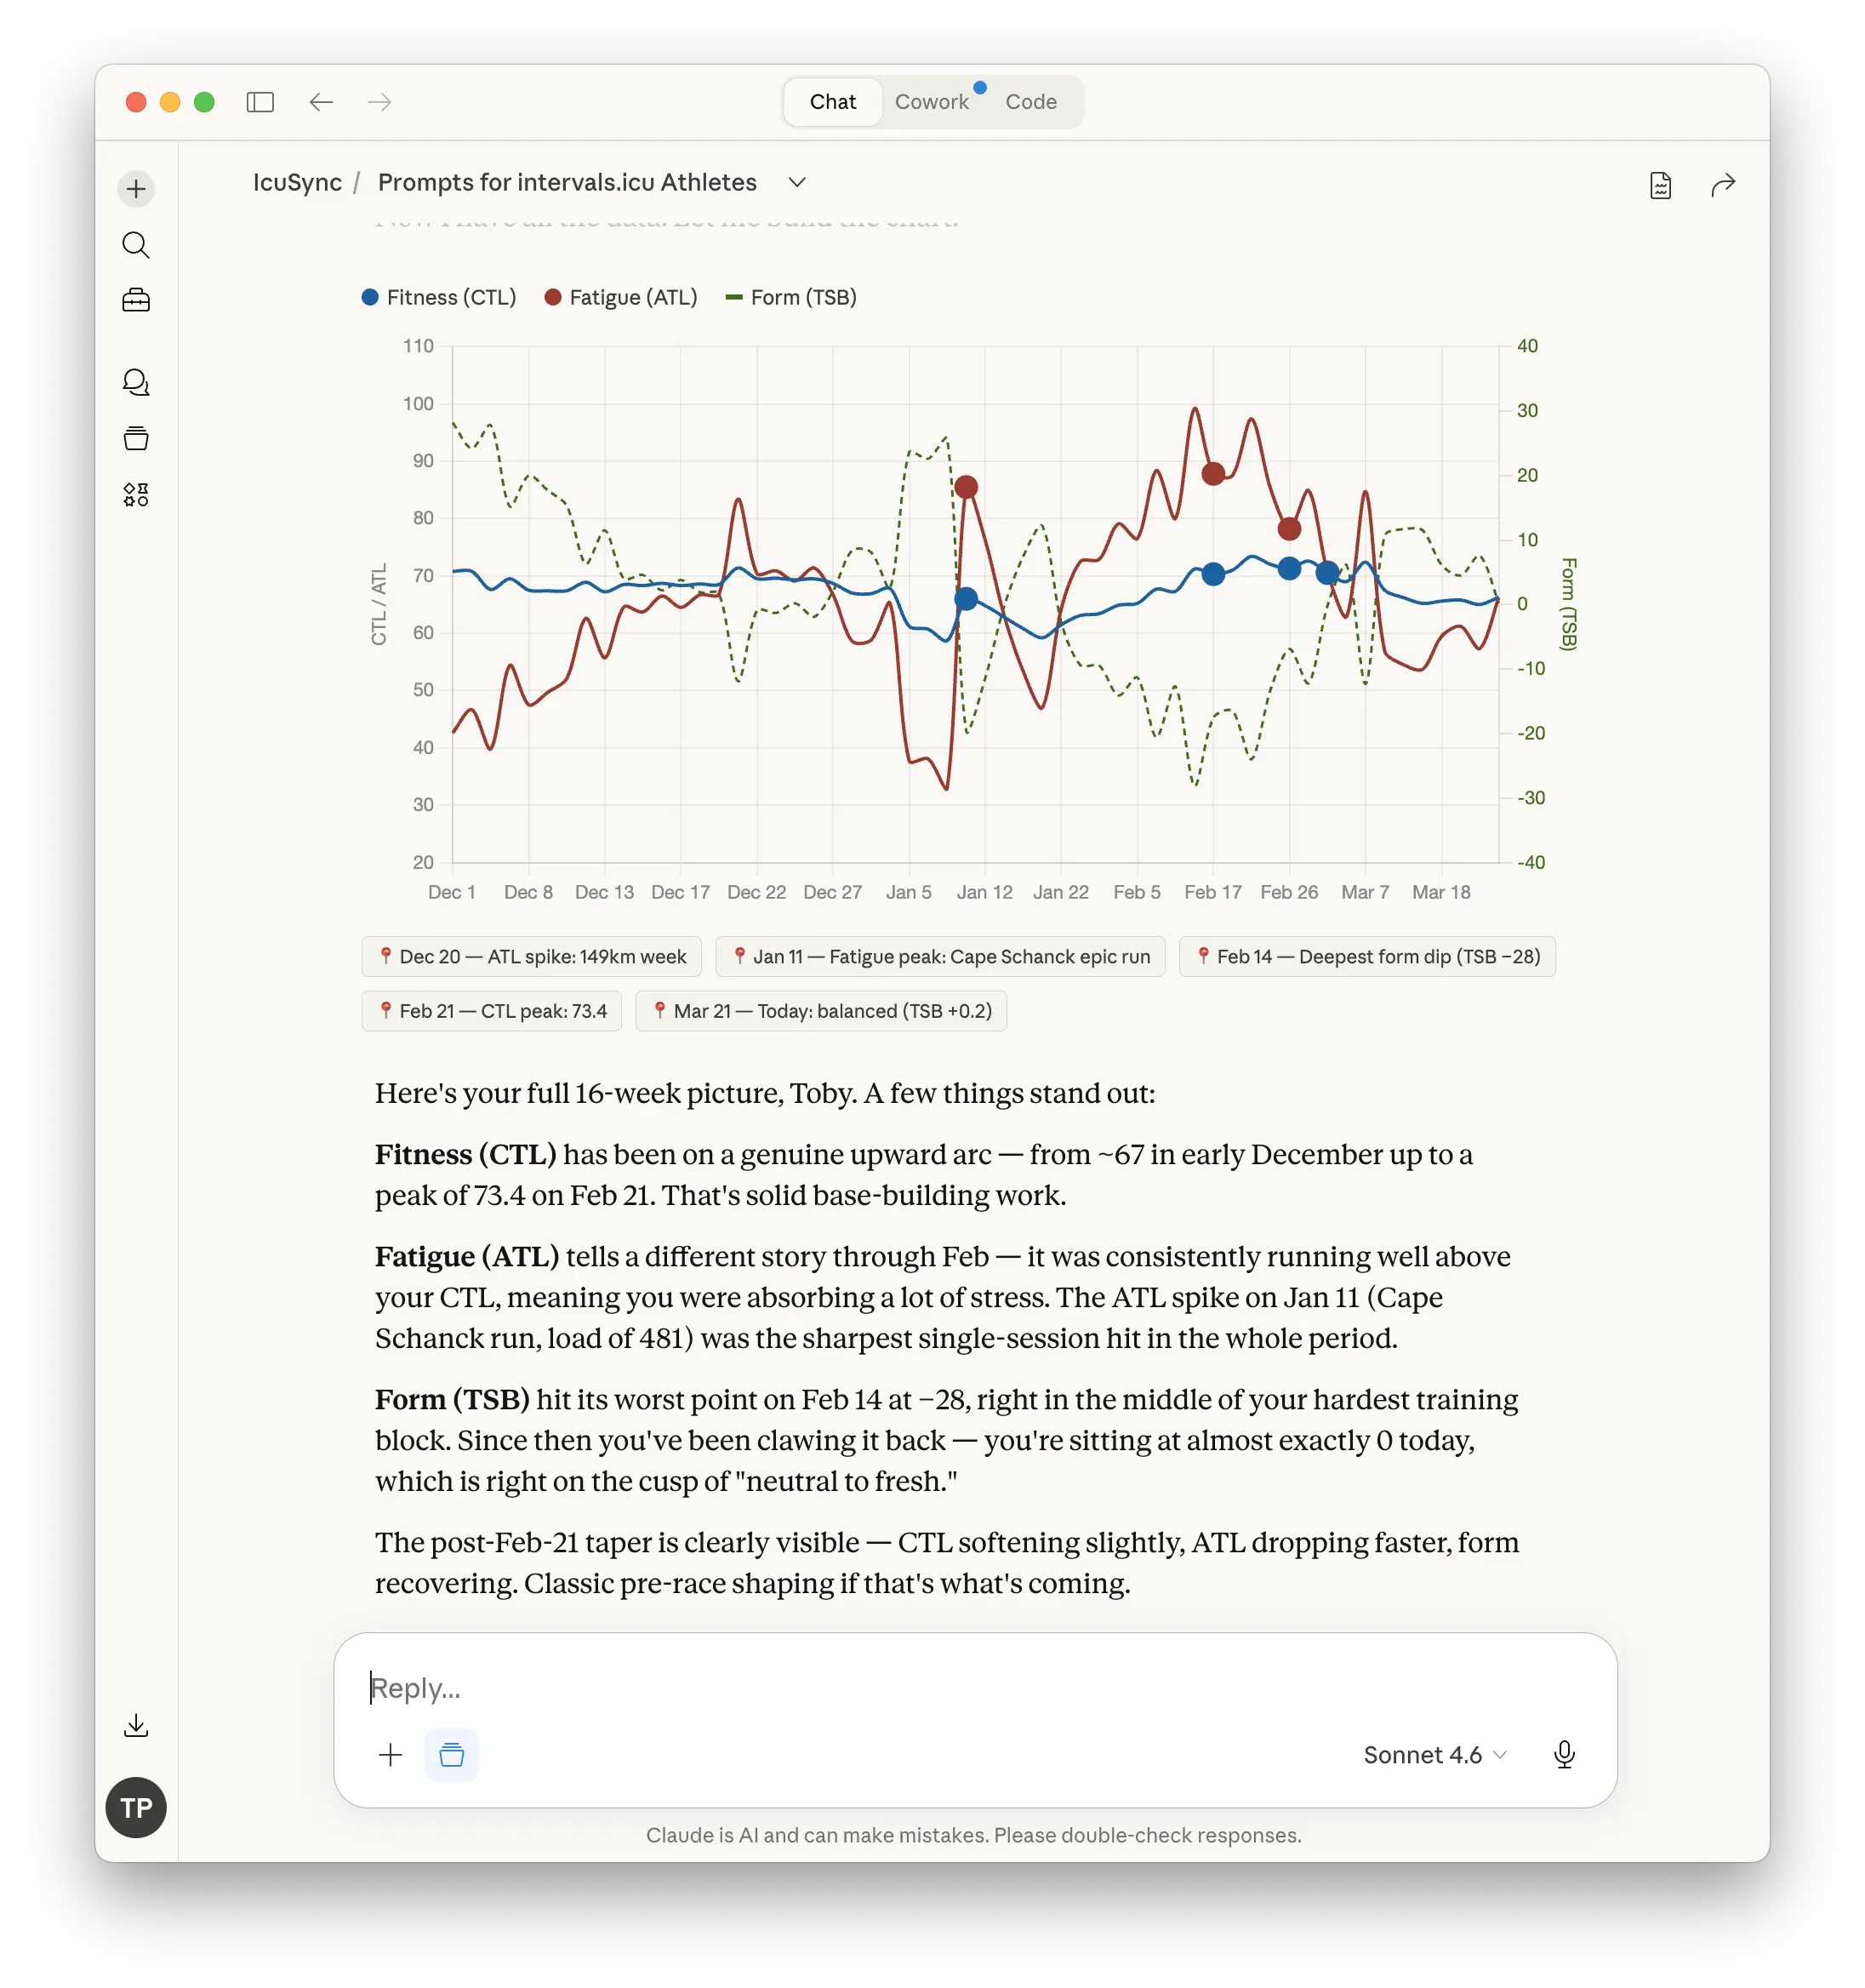
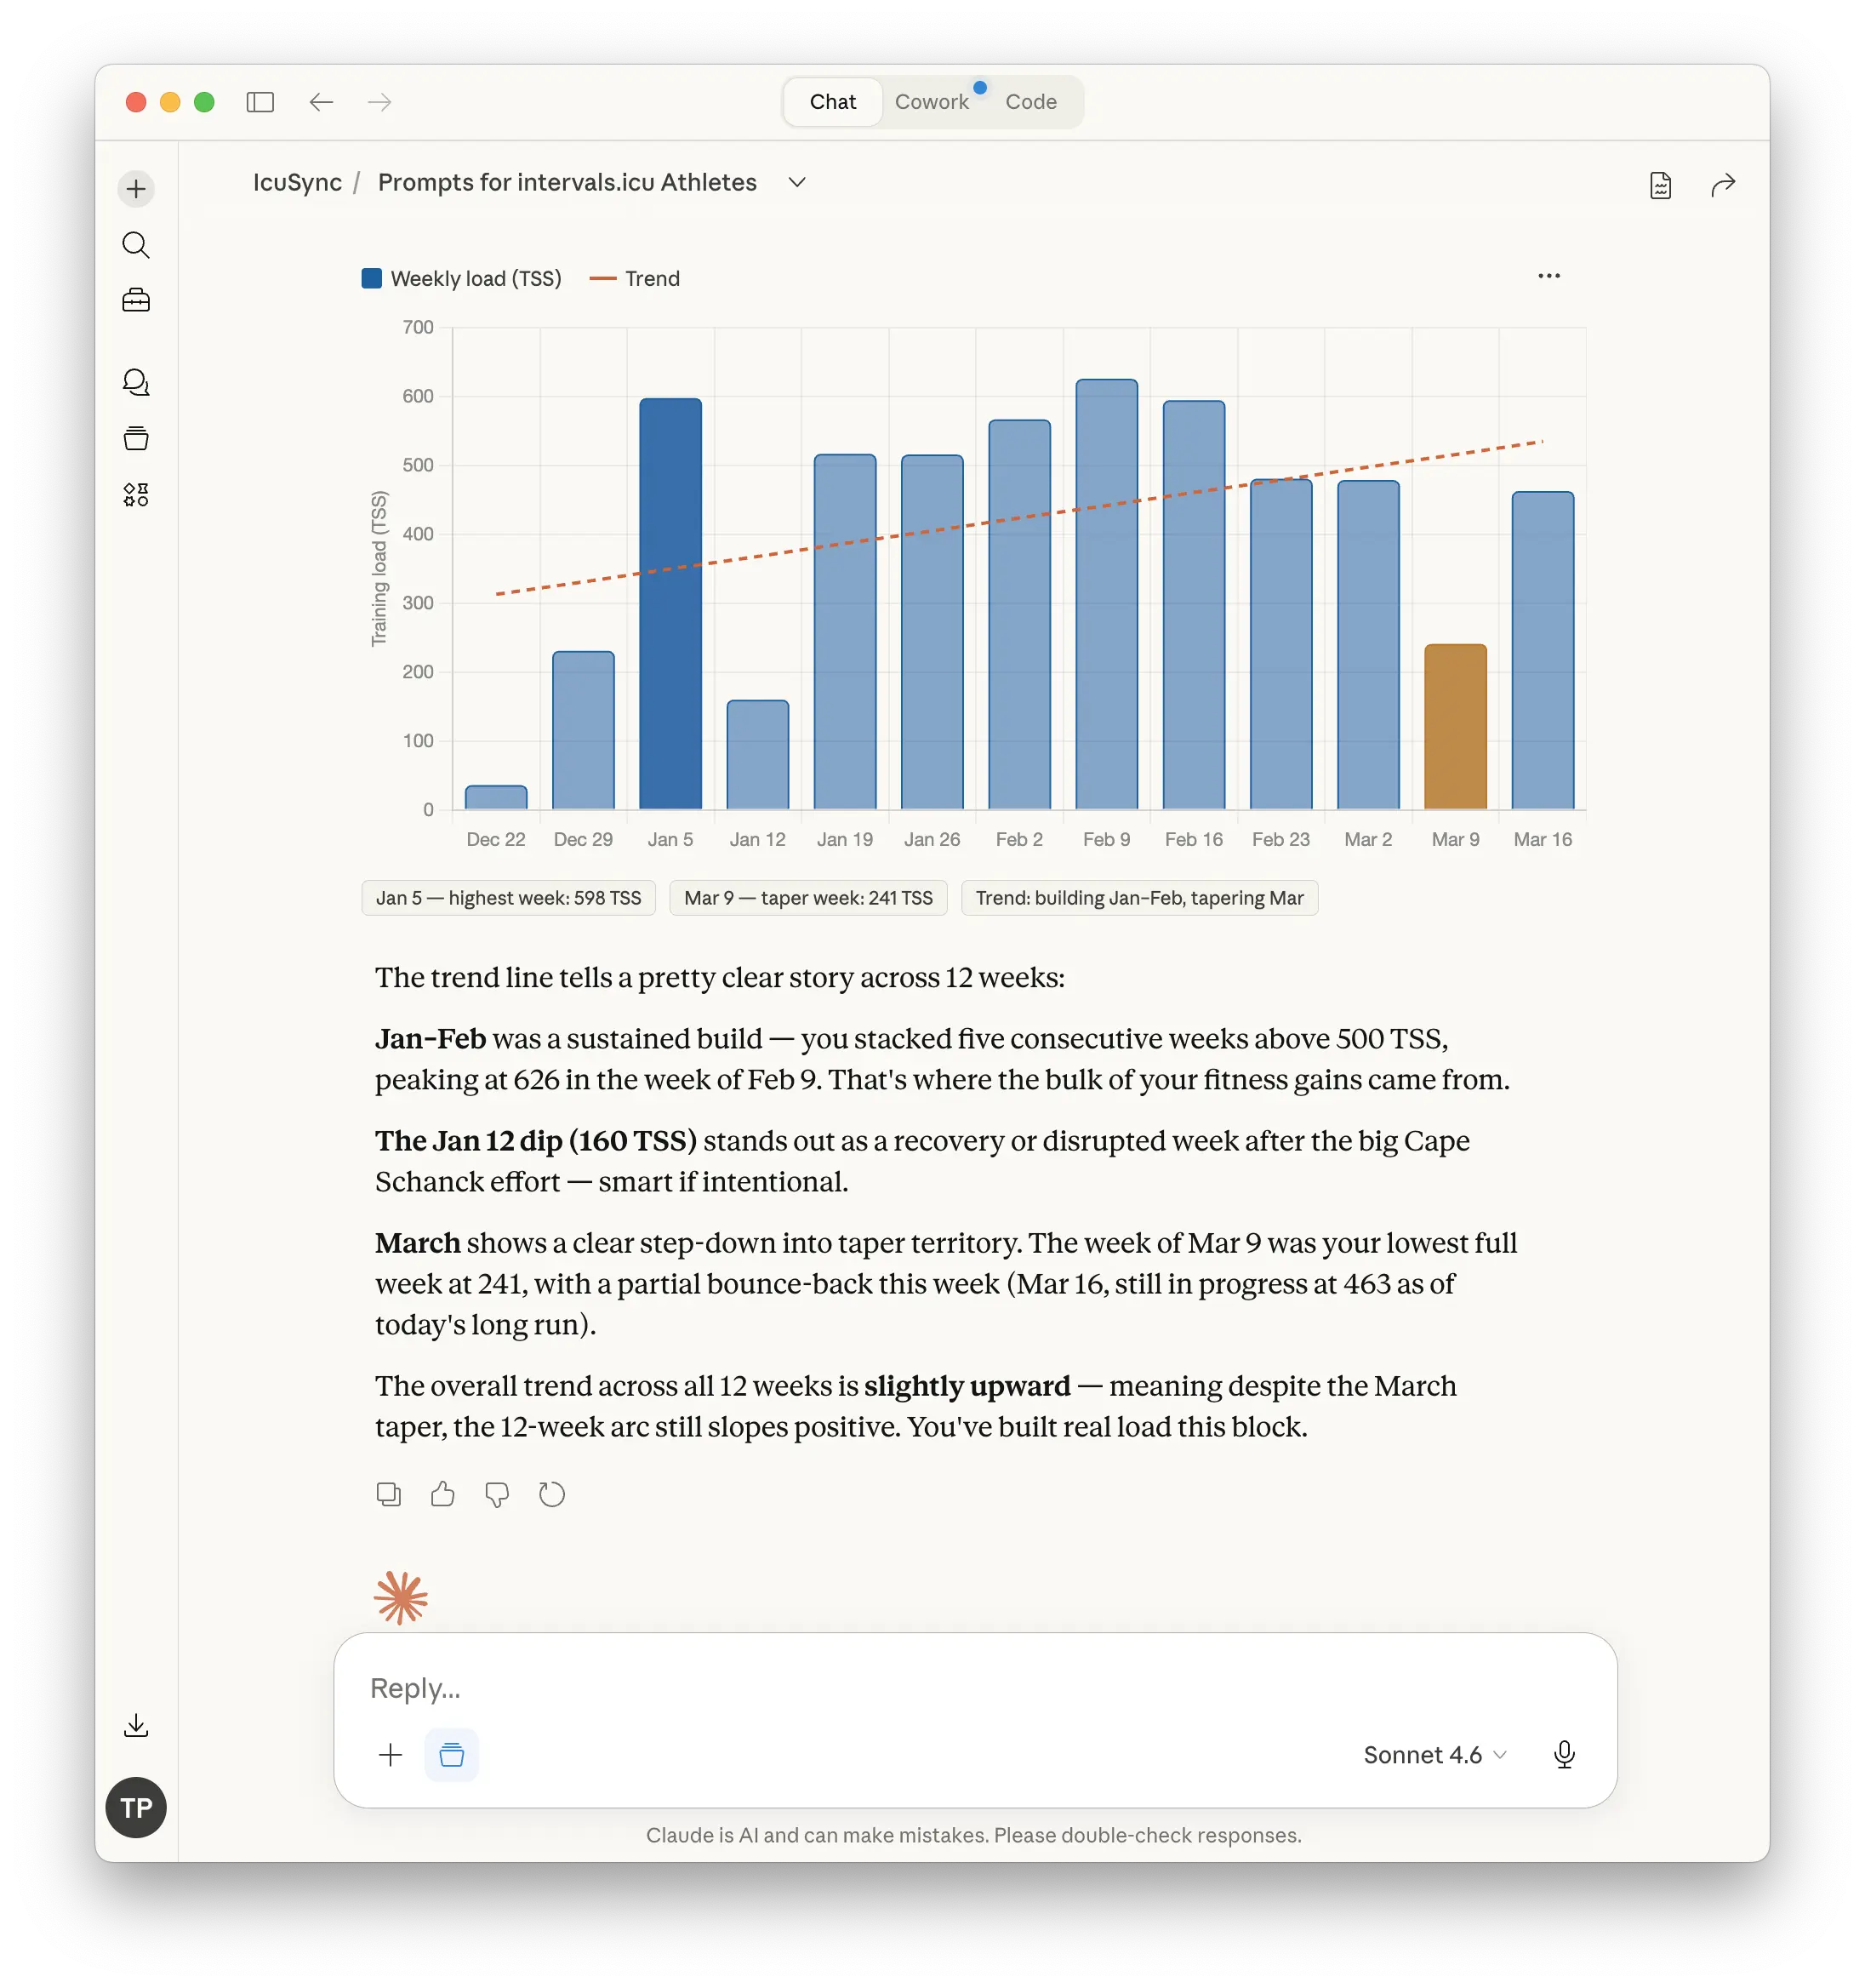
Chart your weekly training load
Generate a bar chart of my weekly training load for the last 12 weeks. Show each week's total and add a trend line so I can see whether my load is building, flat, or declining.
Visualise your zone distribution
Look at my last four weeks of running and generate a chart showing how my training time is distributed across zones. Am I spending the right amount of time in each zone for a base building phase?
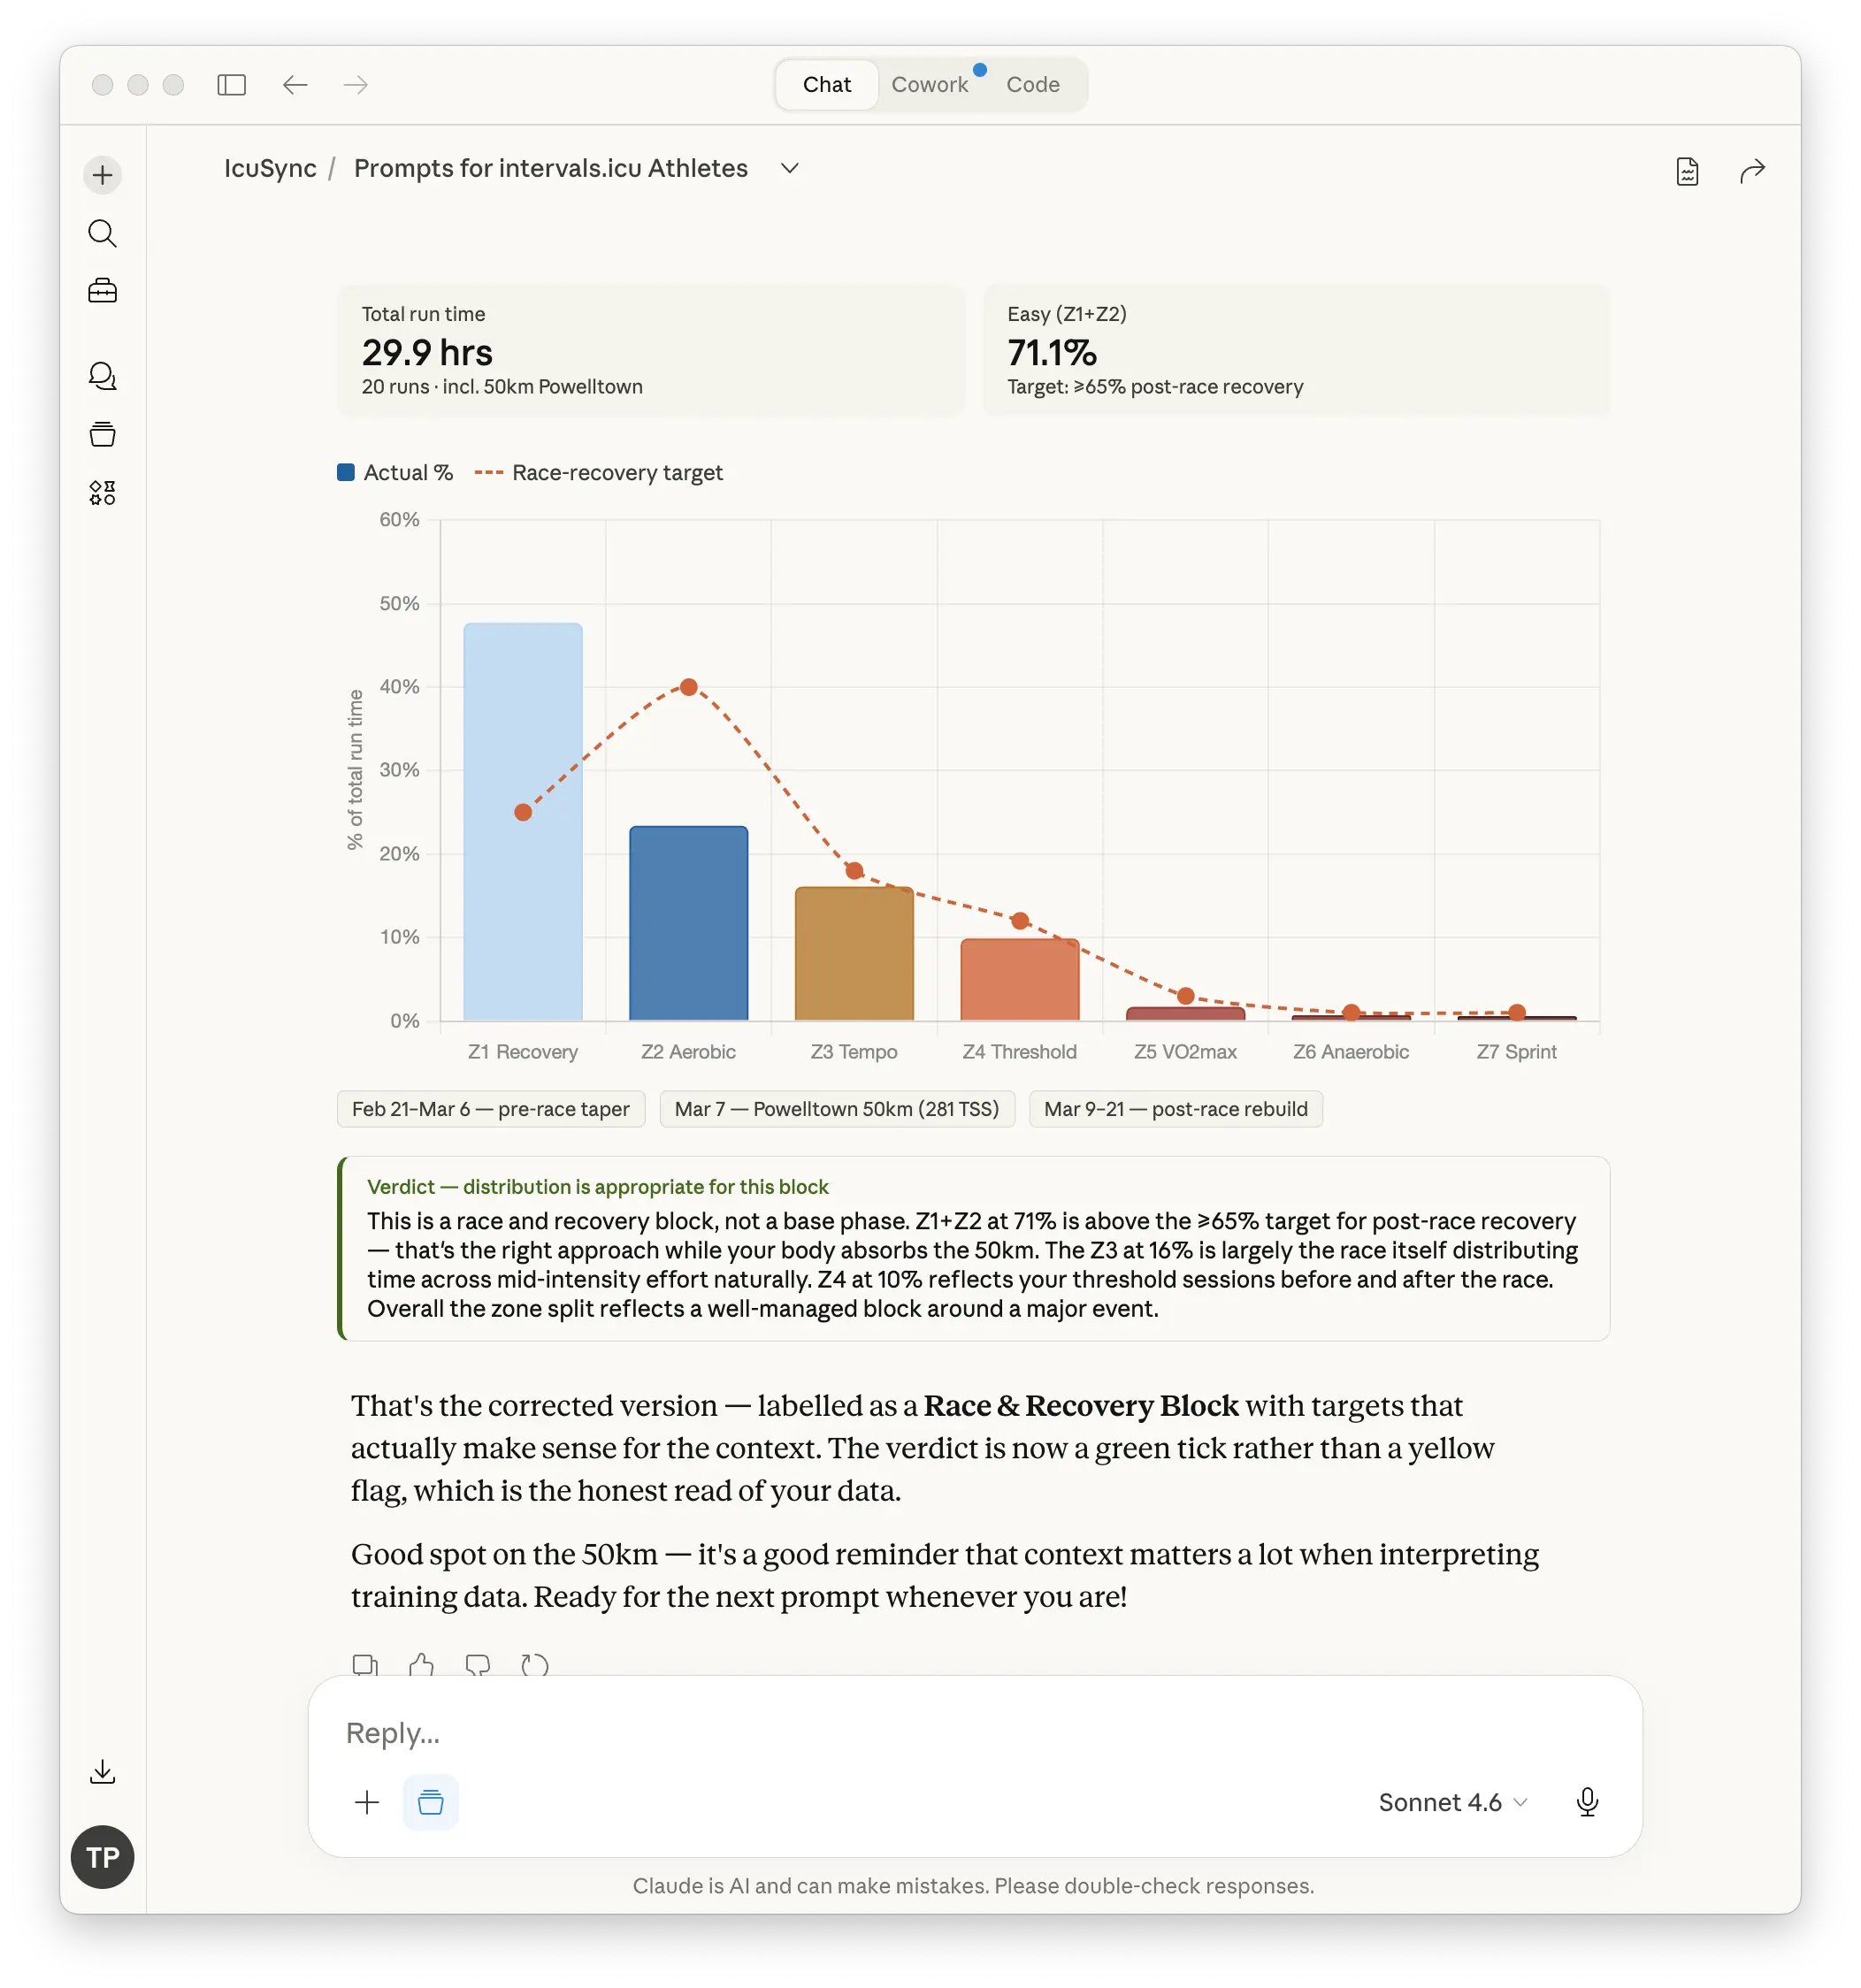
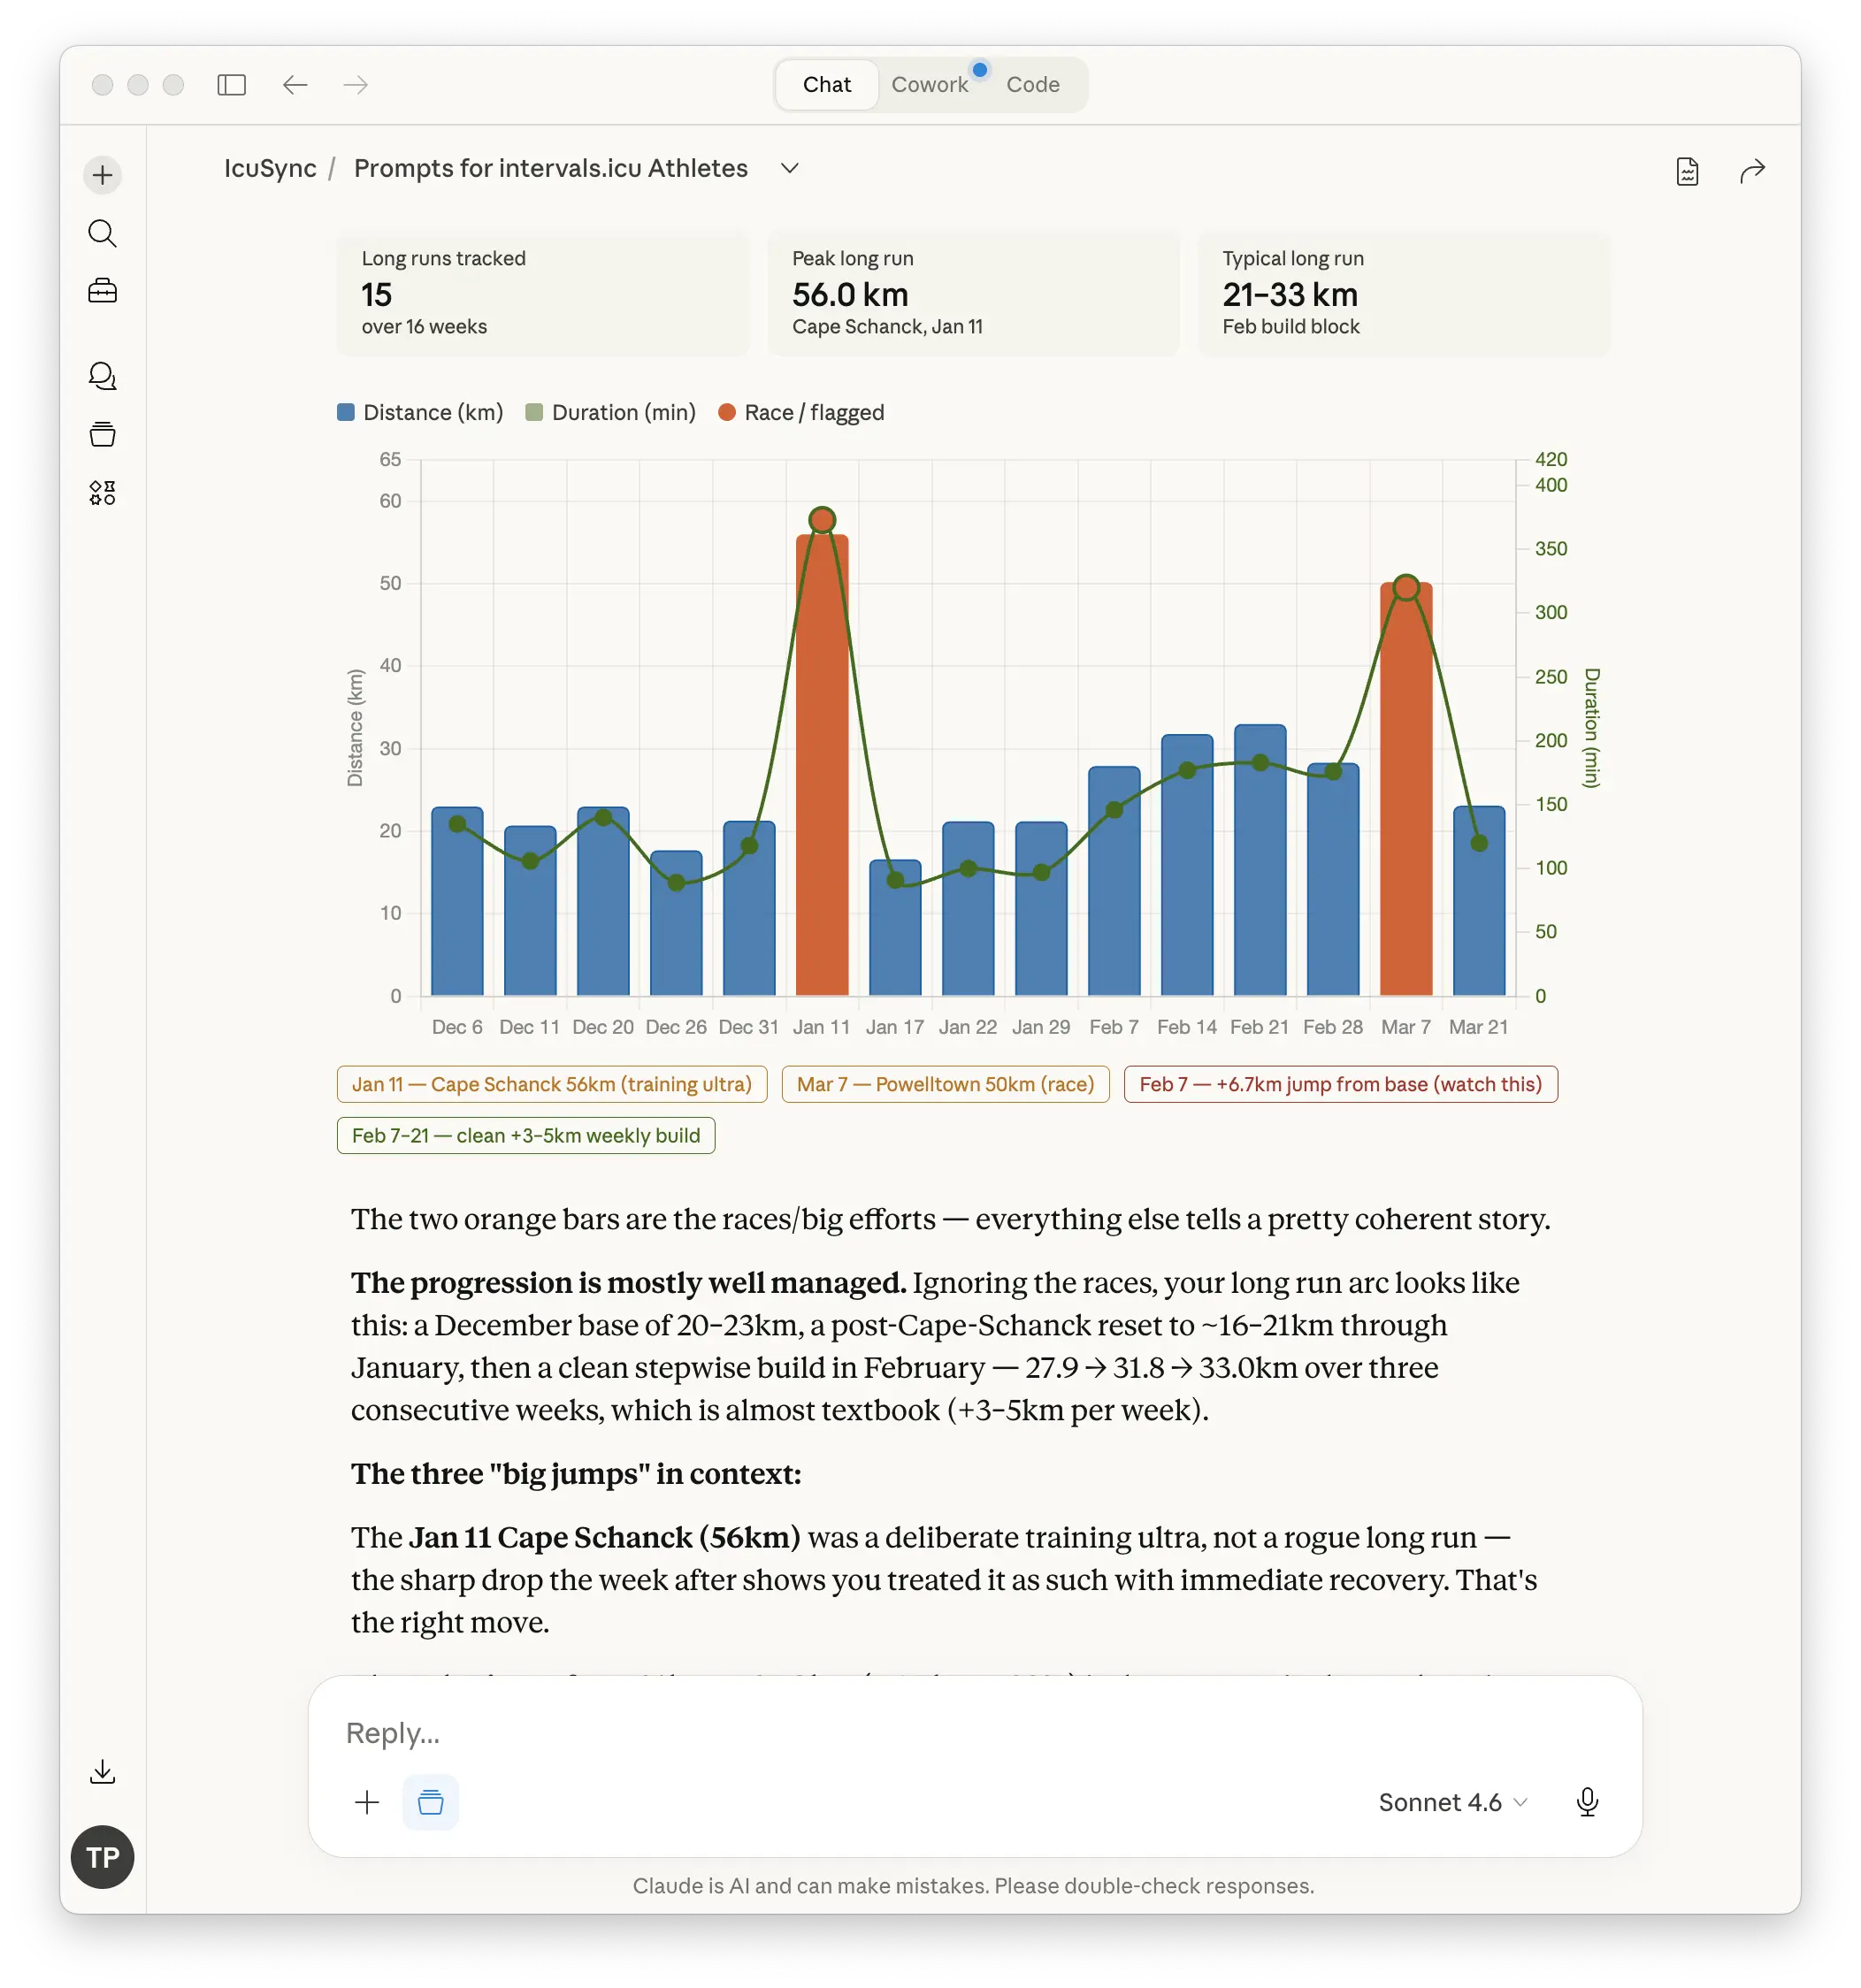
Chart your long run progression
Pull all my long runs from the last 16 weeks and generate a chart showing how the distance and duration have progressed. Is the progression gradual enough or have there been any big jumps?
Visualise your pace improvement over time
Look at my threshold or tempo efforts over the last three months and generate a chart showing whether my pace at that effort level has improved. Show the trend line.
These charts live in the Claude conversation, they are generated from your Intervals.icu data in real time. Save any you want to keep by downloading them from the conversation before closing it.
Building workouts
Build me a threshold session
Write me a threshold running workout for today. I want approximately 40 minutes total including warm-up and cool-down. Use my current threshold pace. Push it to my calendar for today.
Build me an easy recovery run
Write me an easy 45-minute recovery run at Z1 to Z2 pace. Keep it simple, warm-up, easy running, cool-down. Push it to my calendar for tomorrow.
Build me a VO2 max session
I want a VO2 max interval session. Use a 4 x 4 minute format with 3 minutes recovery between efforts. Include a 10-minute warm-up and cool-down. Use my current zones. Push it to my calendar for [date].
Build me a long run
Write me a long run for Sunday. I want 90 minutes total, mostly at easy pace with the last 20 minutes at marathon pace. Push it to my calendar.
Build me a power-based workout with Stryd
Write me a threshold running workout using power zones. 40 minutes total including warm-up and cool-down. Use my Critical Power from my Intervals.icu profile to set the targets. Push it to my calendar for today.
Adjust a workout I am not happy with
That session feels like too much volume for where I am this week. Shorten the main set and keep the warm-up and cool-down the same. Update it on my calendar.
Weekly review
Give me a weekly training summary
Summarise my training from the last seven days. How many sessions did I complete, what was my total load, and how did it compare to the previous week? What went well and what could be improved?
Did I hit my planned training this week?
Look at what was planned on my calendar this week versus what I actually completed. Where did I miss or modify sessions and what does that mean for next week?
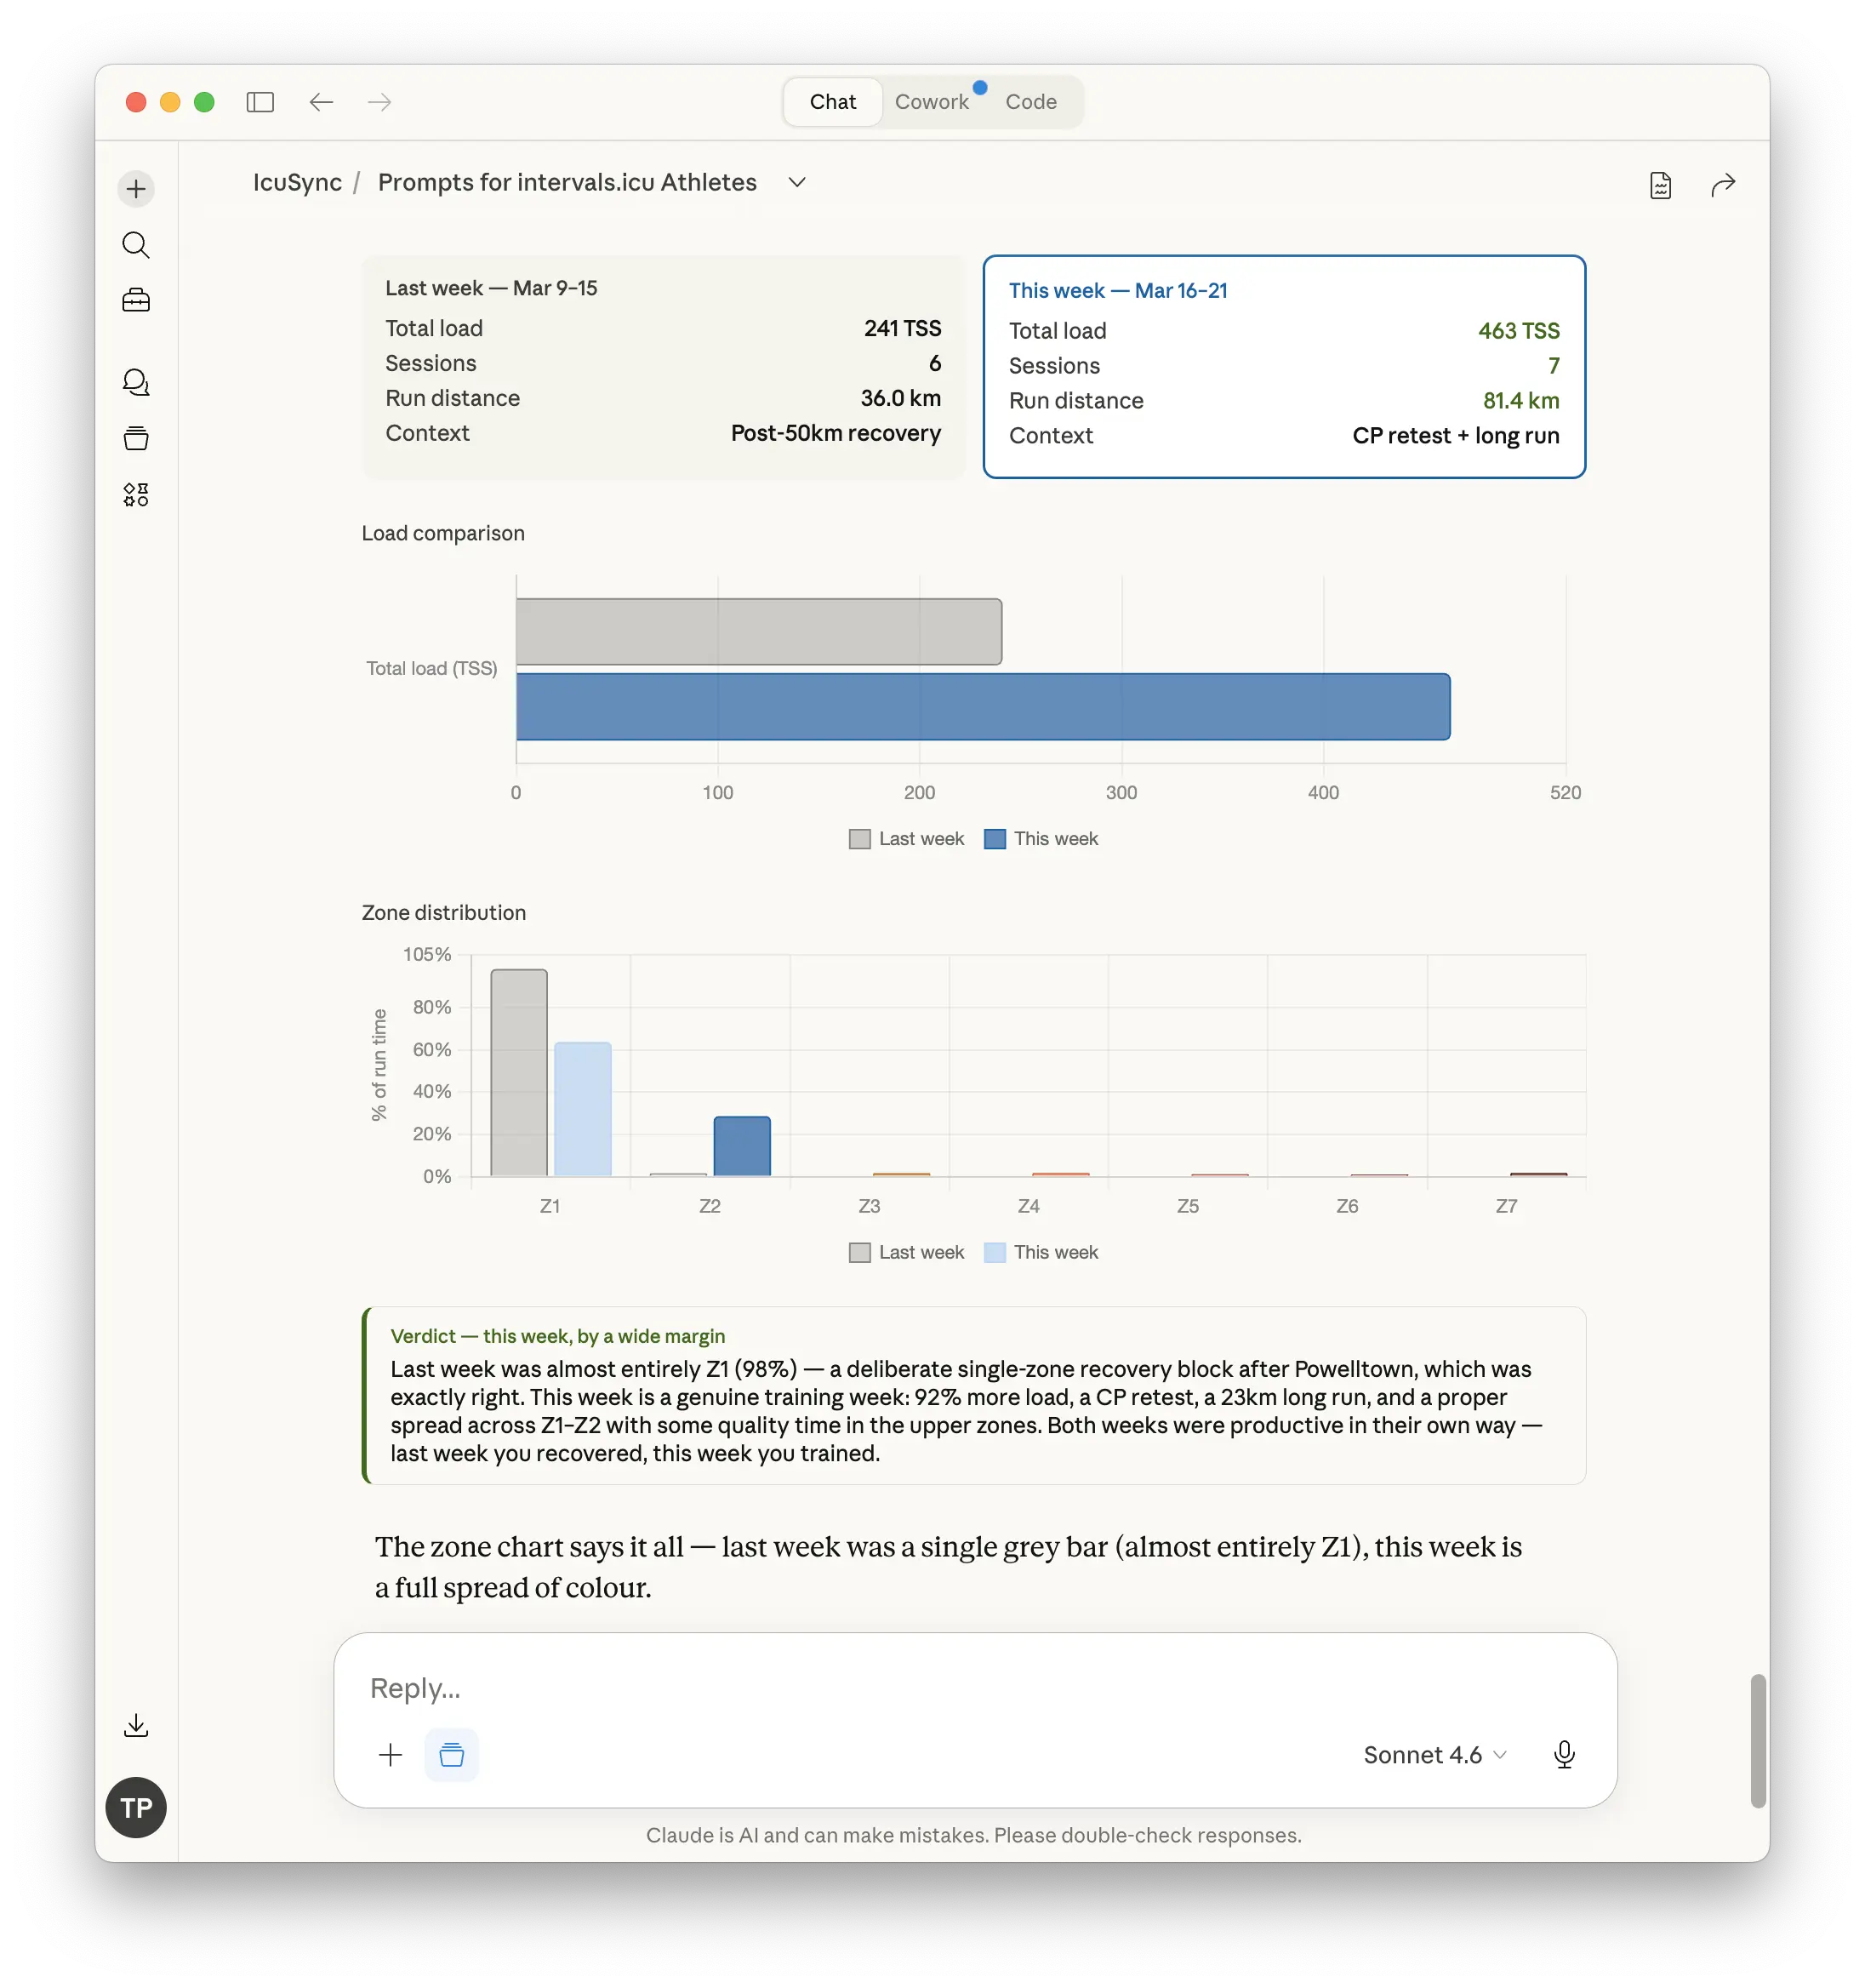
Generate a summary chart of this week versus last week
Compare this week's training against last week and generate a simple chart showing the difference in load, session count, and zone distribution. Which week was more productive?
Race and block planning
Where do I stand ahead of my race?
My goal race is in [X] weeks. Based on my current fitness and recent training, am I on track? What should I focus on between now and race day?
What should my training focus be for the next four weeks?
Based on my current fitness, fatigue, and the time I have available, what should my training emphasis be for the next four weeks? I can train [X] days per week with a long run on Sundays.
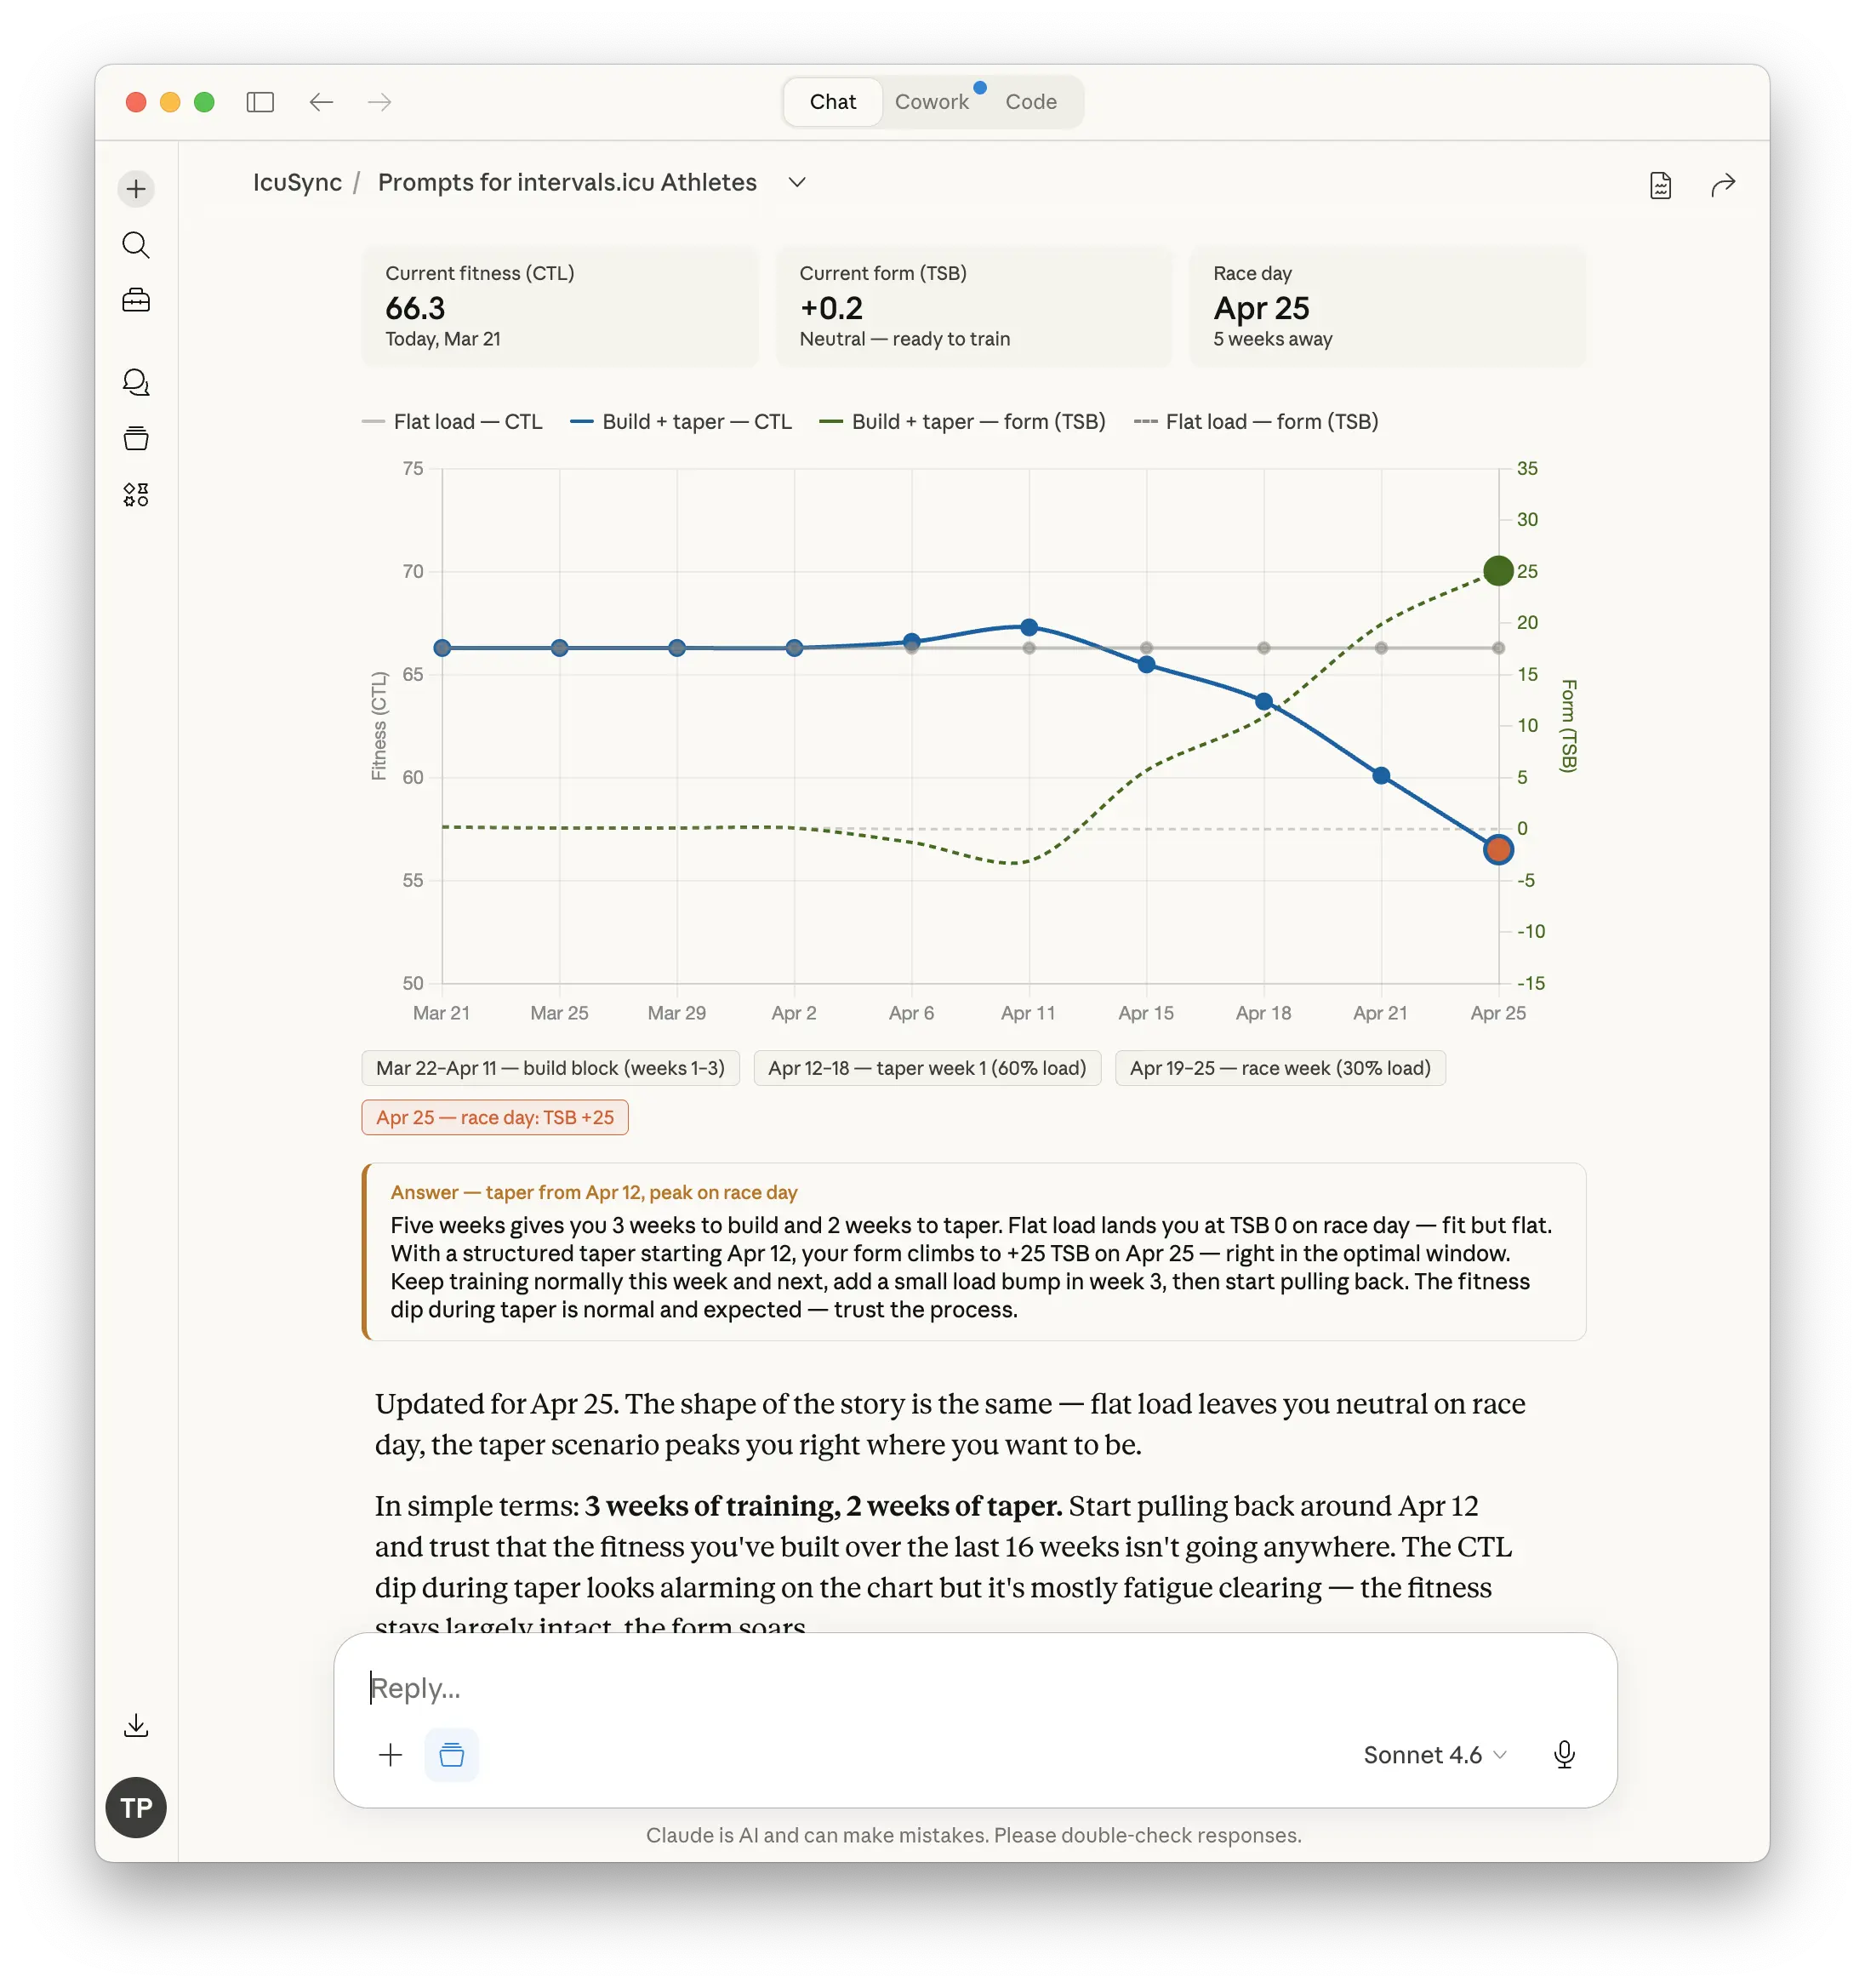
Generate a chart of my fitness trajectory to race day
Based on my current fitness level and my goal race in [X] weeks, generate a chart showing what my fitness curve would look like if I train consistently at my current load. Will I be peaking at the right time?
How should I taper?
My race is in two weeks. Based on my current fitness and fatigue, build me a two-week taper plan. I want to arrive on the start line fresh but not flat. Push the sessions to my calendar.
Reviewing your progress
over a training block
These prompts work best at the end of a training block, after a race or at a natural break point in your training year.
Give me a full block review
I just finished a [X] week training block. Pull all my data from that period and give me a complete review. How did my fitness progress, where was I consistent, where did I fall short, and what should I do differently in the next block?
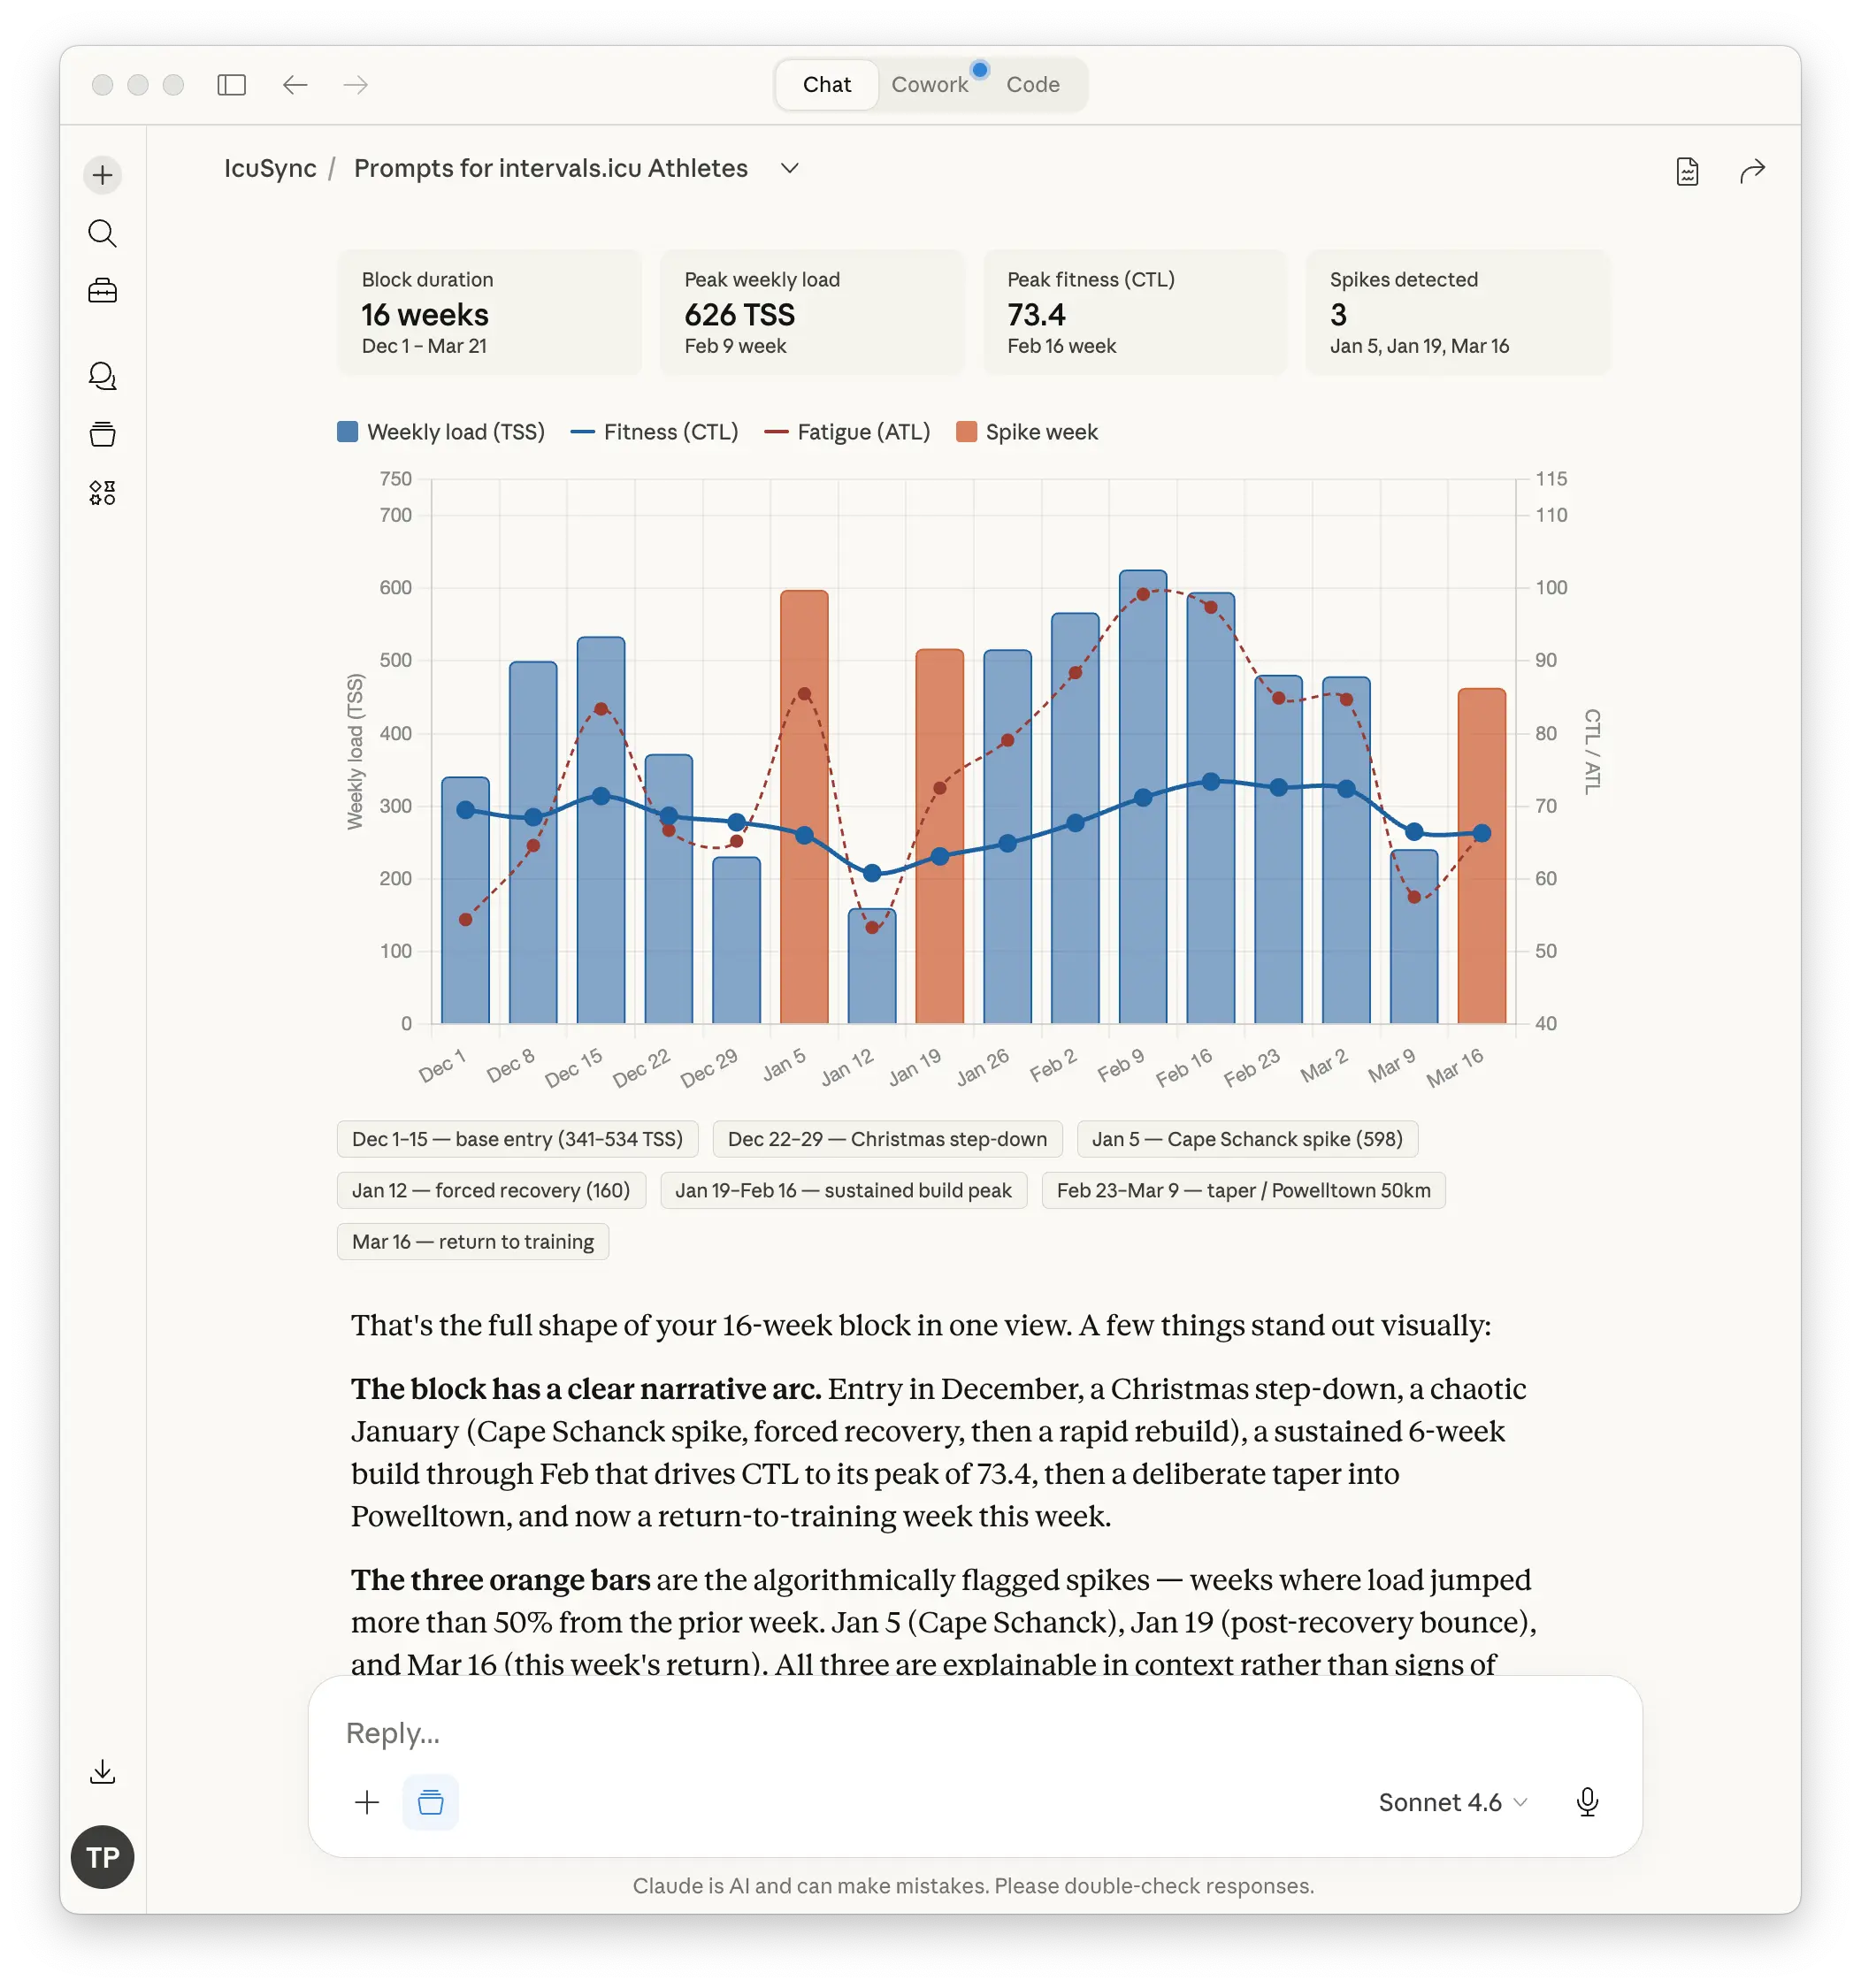
Generate a block summary chart
Pull my training data from the last [X] weeks and generate a chart showing my weekly load, fitness trend, and any significant gaps or spikes across the whole block. I want to see the shape of the block visually.
What did I learn from this block?
Based on my training data and how my fitness responded, what are the three most important things I should take into my next training block? Be specific and use my actual data to support the points.
Tips for better results
Keep your threshold values current. Claude uses your threshold pace and Critical Power from Intervals.icu to set workout intensity targets. If these are out of date, your workouts will be off and your charts will not reflect your actual fitness accurately. Update them in Intervals.icu Settings → Sport Settings after any significant fitness change or formal test.
Give Claude context before asking it to build anything. Tell it how your legs feel, what phase of training you are in, and whether anything happened this week that should affect the session. The more it knows, the better the output.
If a workout feels wrong, say so. Claude will adjust. Tell it the session feels too long, too intense, or not right for today and it will revise it and update your calendar. You do not need to accept the first version.
Use a Claude Project for your training. If you do all your training conversations inside a dedicated Claude Project, Claude carries context from one session to the next. It will remember your goal race, your agreed training approach, your injury history, and anything else you have told it. This makes every prompt sharper over time because Claude already knows who you are and what you are training for.
Read more about setting up a Claude Project for your training: [How Claude Gets Better the More You Train Together →]