Every IcuSync Tool, Explained
By Toby Pattullo
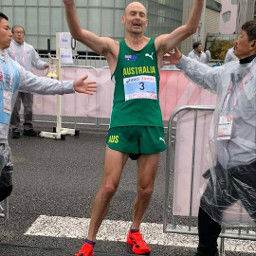
Australian Deaflympic marathon and ultra runner, and the solo developer behind IcuSync.
IcuSync gives Claude 24 tools to work with your Intervals.icu data. This page covers the 17 read tools, the ones Claude uses to understand your training. Each one below explains what it returns, why it matters, and a sample prompt to try.
This page reflects the tool set as of 17 September 2026. New tools get added regularly, check the changelog for the latest.
We've grouped them by what you're actually trying to find out, not alphabetically.
Who you are
get_athlete_profile
This is the first thing Claude checks in most conversations. It returns your training zones, thresholds (FTP, threshold pace, LTHR), and sport settings for each discipline you've set up in Intervals.icu.
Claude also validates this data automatically. If your FTP looks stale compared to recent power numbers, or a zone is missing for a sport you're active in, Claude will flag it before giving you analysis that depends on it.
Try asking: "What are my current training zones?"
What you've done
get_training_history
A list of your recent activities: sport, duration, distance, load, and the gear and tags attached to each one. This is usually the starting point for any question about a block of training rather than a single session.
Try asking: "What did my training look like over the last two weeks?"
get_activity_detail
The full breakdown of one specific activity: interval-by-interval pace, power, and HR, exact distance splits (independent of how your device auto-lapped it), and weather conditions if they were recorded. Splits are computed straight from the GPS or distance stream, so they're accurate even when a workout's auto-detected segments don't land on clean km or mile boundaries.
Try asking: "Break down my splits from yesterday's tempo run."
get_extended_metrics
Sensor data most apps don't surface clearly: core temperature, DFA alpha-1, W' balance depletion, blood glucose for cyclists, ground contact time and vertical oscillation for runners. Also includes any custom Activity Fields you've set up (lactate, RPE, pain scores).
For W' balance specifically, Claude can see not just the average but how low your reserve actually dropped and how long you spent deeply depleted, which is the difference between a ride that never troubled your matches and one that burned through them despite a similar average power.
Availability depends on your device and sensors.
Try asking: "How did my ground contact time and vertical oscillation look in yesterday's run?"
Where you're at
get_fitness
Your CTL (fitness), ATL (fatigue), and TSB (form) across any date range. Claude checks this automatically before recommending a training plan, so workouts reflect your actual recovery state rather than an assumed baseline.
Try asking: "How's my form looking heading into this weekend's race?"
get_training_summary
Aggregated stats over a date range: total volume, TSS, and calories by sport, time in each power/HR/pace zone, and a week-by-week breakdown. This is the tool for block reviews rather than single-session detail.
Try asking: "How much Zone 2 have I done this month?"
How you're recovering
get_wellness
Daily sleep, HRV, resting heart rate, body weight, and nutrition (kcal, carbs, protein, fat if you log food in Intervals.icu). Anything device-synced comes through automatically; subjective scores only appear if you or your watch log them.
Try asking: "Has my HRV trended down this week?"
What's coming up
get_events
Your planned calendar: upcoming workouts, races, and any notes attached to them, including fueling targets (carbs per hour) and planned load if you've set those.
Try asking: "What's on my calendar for next week?"
get_training_plan
Reads the training plan you're currently assigned to in Intervals.icu, if you have one: name, duration in weeks, which week you're in, target hours per week, and the starting fitness it was built around. This is the structure behind your calendar, not the calendar itself, use get_events for the day-to-day schedule a plan generates.
Read-only. It can't browse other plans in your library or switch you onto a different one, that stays a deliberate action in Intervals.icu.
Try asking: "What week of my plan am I in, and what's the target hours for this block?"
How strong you are
get_best_efforts
Your personal bests across standard distances and durations, pulled directly from Intervals.icu.
Try asking: "What's my 10K PB this year?"
get_power_curves
Your best power output across key durations, plus CP and FTP model estimates, for run and ride. Also supports durability curves, your power after a set amount of accumulated work (e.g. after 1000 kJ), so you can see how you hold power in a fatigued state rather than fresh. Durability thresholds need to be set on your Intervals.icu power curve chart first.
Try asking: "Has my 20-minute power improved this block?"
Comparing to past efforts
get_comparable_efforts
Finds past activities with an interval effort matching a target duration and intensity, for example a 4-minute rep around 120% FTP. Built for programme reviews and progression tracking rather than the last few days: "have I done this before, and how does it compare" over months, not one session.
Each match includes the specific interval(s) that actually fit the search, not just the activity name, so you can see the real duration and intensity Claude matched on rather than take it on faith.
Try asking: "Find times I've done a 4-minute effort around 120% FTP, and show me how today's compares."
Advanced analysis
These two are more specialised. Useful if you want to go deeper on climbing or technical terrain, skip them if you just want the basics. Climb segments work across sports, ride power patterns is cycling-specific.
get_climb_segments
Detects sustained climbs in an activity and calculates VAM (vertical ascent in meters per hour) for each one, along with grade and average power if you have a power meter. Works for rides, runs, hikes, and walks. Handles climbs with a brief flat or downhill "shelf" partway up by bridging them into one segment instead of splitting the climb into pieces.
Try asking: "Which climb on today's run or ride had the best VAM?"
get_ride_power_patterns
For technical or rolling rides where average power and zone time hide what's actually happening. Splits coasting time into short coasts (a breather between pedal strokes on a technical section) and long coasts (a real descent or stop), and detects repeated hard/easy burst patterns, the on-off surges typical of MTB, cyclocross, gravel, or criterium racing. A ride can look unremarkable on average power alone while actually being a string of repeated efforts, this tool is what shows that.
Requires a power meter, ride activities only.
Try asking: "Was that gravel ride actually steady, or a lot of surging?"
get_interval_intensity_stats
For interval and lap sessions where the average of a rep is misleading. Slices the power or pace stream to each interval on the server and returns the median, the interquartile range (the spread of the middle half), a coefficient of variation for how steady the effort was, and a "settled" average that excludes the lead-in ramp. A 4-minute rep that averages low only because the first 15 seconds went on spinning up to pace will still show what you actually held once you got there.
Give it a target band and every interval also reports how long you spent inside it, below it, and above it, so you can tell whether you were on target during the work or just on average across it.
Works for any activity with defined intervals and either a power meter or a speed trace: rides, rowing, and runs with or without running power. Only the computed summary is returned, never the raw stream.
Try asking: "In yesterday's 8x4min reps, what power did I actually hold once each rep settled, and how much of each rep was inside my target range?"
get_grade_adjusted_pace
Converts your actual pace on a hilly run into what that effort would look like on flat ground. Uses the same running-economy-of-grade model behind grade-adjusted pace (GAP) on Strava, TrainingPeaks, and Intervals.icu itself, not a new formula. Returns raw pace next to GAP for each km or mile split, plus a whole-run comparison, so a run that looks slow on paper can be read for what it actually cost once the hills are factored in.
Running only, rides don't need this since power already accounts for grade. If there's no elevation data for the activity, you get raw pace only, GAP is never guessed at.
Try asking: "How hard was that hilly long run really, once you account for the climbing?"
get_pacing_shape
Splits a continuous run or ride into halves or thirds and tells you whether you negative split, positive split, or paced it evenly, using completed data rather than a pre-race calculator. For runs it compares grade-adjusted pace rather than raw pace, so a run that "slows" late because of a hill still reads as even instead of looking like you faded. For rides it compares normalized power when you have a power meter.
Works on any continuous effort of 10 minutes or more, a 5K counts the same as a marathon, but it always compares halves or thirds of the whole effort, not per-km splits. For a per-km or per-mile breakdown, use get_grade_adjusted_pace instead.
This is for continuous efforts: long runs, tempo sessions, races, steady rides, not structured interval sets with rest between reps. get_interval_intensity_stats already covers those, and get_pacing_shape will tell you as much rather than force a meaningless read on one.
Try asking: "Did I negative split that half marathon, or fade in the second half?"
None of these need setup on your end. Claude calls the right tool automatically based on what you ask, you don't need to know the tool names above to use them, they're here so you know what's possible.
IcuSync has 21 tools in total. This page covers the 15 read tools above. The other 6 write data back to Intervals.icu, pushing, editing, and deleting workouts, logging wellness data, updating completed activities, and writing threshold values, and are covered elsewhere.
Want more examples? See Prompts & Charts for a bigger collection of prompts to try.